An Initial Exploration of Home Field Advantage in the NFL
January 1st, 2020 / Home Field Advantage /
[New!] Track current and historical home field advantages for every team on nfelo's Home Field Advantage Dashboard
Summary
HFA trends are volatile at the individual season level, but long term trends show a steady decline. From 2000 to 2019, trailing 10 season HFA declined from 2.9 points to 2.2 points
Individual teams may experience periods of elevated HFA, but elevated HFA is not predictive of future elevated HFA across any window of games
Variation in HFA for individual games does not appear to be significantly influenced by the mileage traveled by the away team. Away travel correlates with divisional games, which exhibit a much stronger relationship with HFA
Modeled HFA is 2.95 non-divisional games and 1.59 for divisional games
Introduction to Home Field Analysis to Date
Home Field Advantage (HFA) is the average advantage, generally measured in points, that a team experiences when playing in their own stadium. In the NFL, HFA is generally accepted to sit somewhere between 2 and 3 points. However, past analysis shows this number to fluctuate by team and over time. From 2007 to 2017, the NFL’s strongest observed HFA (Seattle’s 5.1) was a full 4.4 points larger than its weakest (Miami’s 0.7). Similarly, league wide HFA was 2.2 in 2018, but fell to -0.9 points just one season later in 2019.
While using a number between 2 and 3 to account for HFA may be a good starting point, it’s clear that variance exists within this average. By exploring this variance, we may be able to generate a more accurate estimate of HFA for predicting NFL games.
Overall Trends
Over an individual season’s worth of games , league wide HFA is quite volatile. In some periods, observed season long HFA is as high as 4.4 points, and in others, it is practically non existent. In the 2008 season alone, observed league wide HFA swung from an 18 year high to an 18 year low:
So while 2019’s negative HFA may be considered a statistically significant event by commonly accepted measures, it hardly represents enough evidence on its own to make a statement about overall HFA trends. Measuring HFA over a longer window does, however, reveal a potentially systemic decline.
From 2000 to 2019, trailing 10 season HFA in the NFL declined from 2.9 points to 2.2 points:
To provide context for the scale of this decline, 0.7 points in the NFL is worth about 30% less than a bye week and represents a 2.4% drop in expected win probability:

The decline appears real and meaningful, but perhaps not as precipitous or sensational as reported. Additionally, this decline is a trend observed within past data and is not necessarily indicative of any further decline in the future. Has HFA bottomed out? Will it stay at 2.209? No available research can answer this question.
Additionally, if short term volatility seems to be responsible for the major variations in an otherwise stable league wide trend, what confidence should we have that variations at the team level are anything but the product of the same volatility?
Individual Teams
Individual team HFA is measured by difference in home and away performance divided by two (to account for the other team’s HFA in away games). To account for changes in HFA overtime, a team’s HFA can be netted out against the league average HFA to create an incremental measure of HFA (i.e. how much better or worse does a team play at home relative to the rest of the league). As we might expect from the league wide data, only a handful of individual teams exhibit sustained periods of elevated HFA, and in these instances, the HFA was not sustained categorically across the span of the franchise.
From 2003 to 2014, Seattle’s trailing 5 season HFA was higher than the observed league average, but in the windows immediately before and after, it was not:
Baltimore had an even longer run of elevated HFA from 1996 to 2018, but in 2019, the team’s trailing 5 season HFA fell below the league average:
Perhaps most surprising is New Orleans, whose vaunted HFA was sustained for just a brief window by comparison:
And New England, whose reputation as a strong home team likely stems from their overall strong performance. New England’s recent home field performance is in line with the overall league average:
In these instances, where HFA appears to stem from something real and measurable, it doesn’t last. Do the crowds become quieter? Does the officiating change? Do rosters turnover?
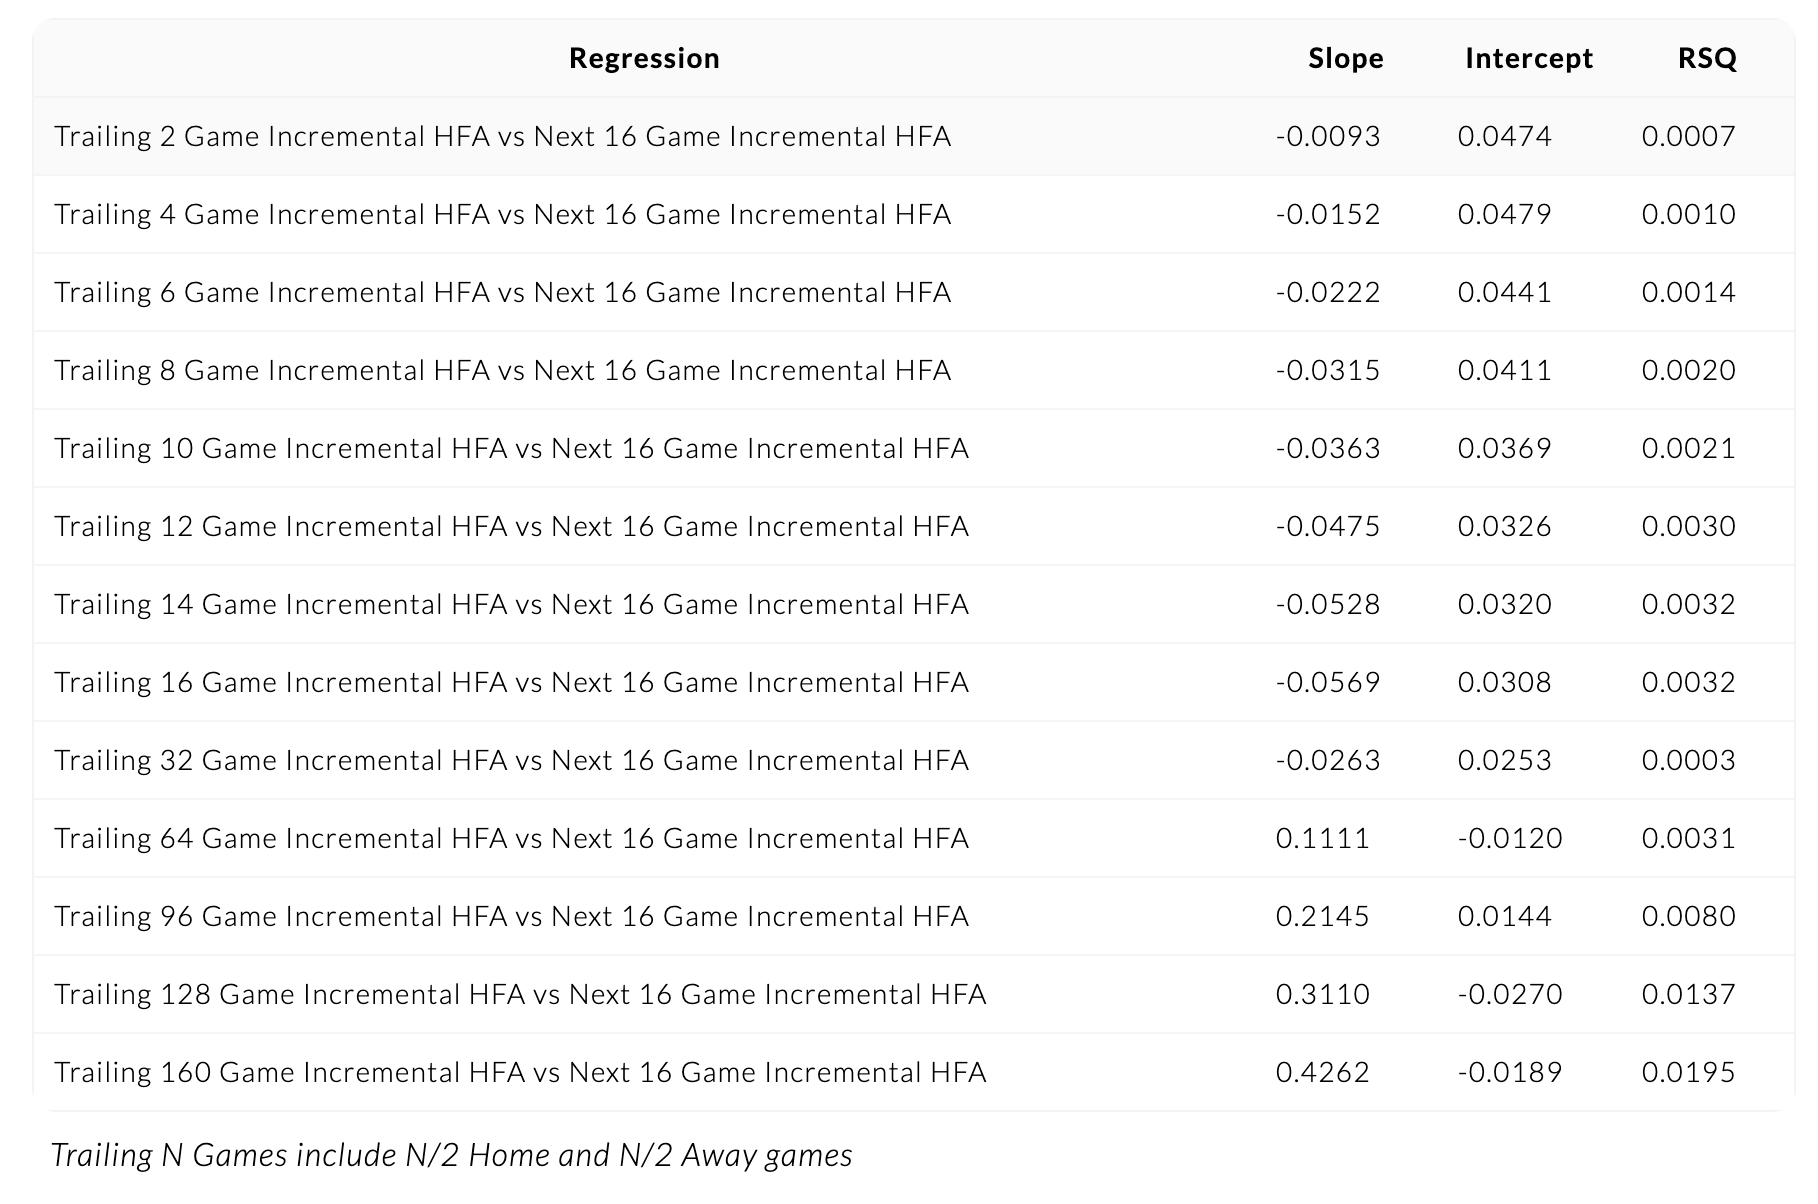
A more scientific way to measure the validity of individual team’s HFA is to regress past its incremental HFA against its incremental future HFA. If teams did exhibit persistent incremental HFA, we would expect the slope of this regression to be 1 and the intercept to be 0--incrementality in the past translates 1-to-1 to incrementality in the future. Instead, regressing future HFA incrementality against past HFA incrementality yields a consistent flat slope:

The flat slope of these regressions likely represents mean regression. When a team’s past HFA is higher than average, the flat slope brings it back down to an intercept around 0. Over these relatively short windows, the slope is actually slightly negative, potentially due to scheduling. A team that plays unusually weak teams at home in the past is likely to play harder teams at home in the future, resulting in a future HFA that is actually negatively correlated with past HFA.
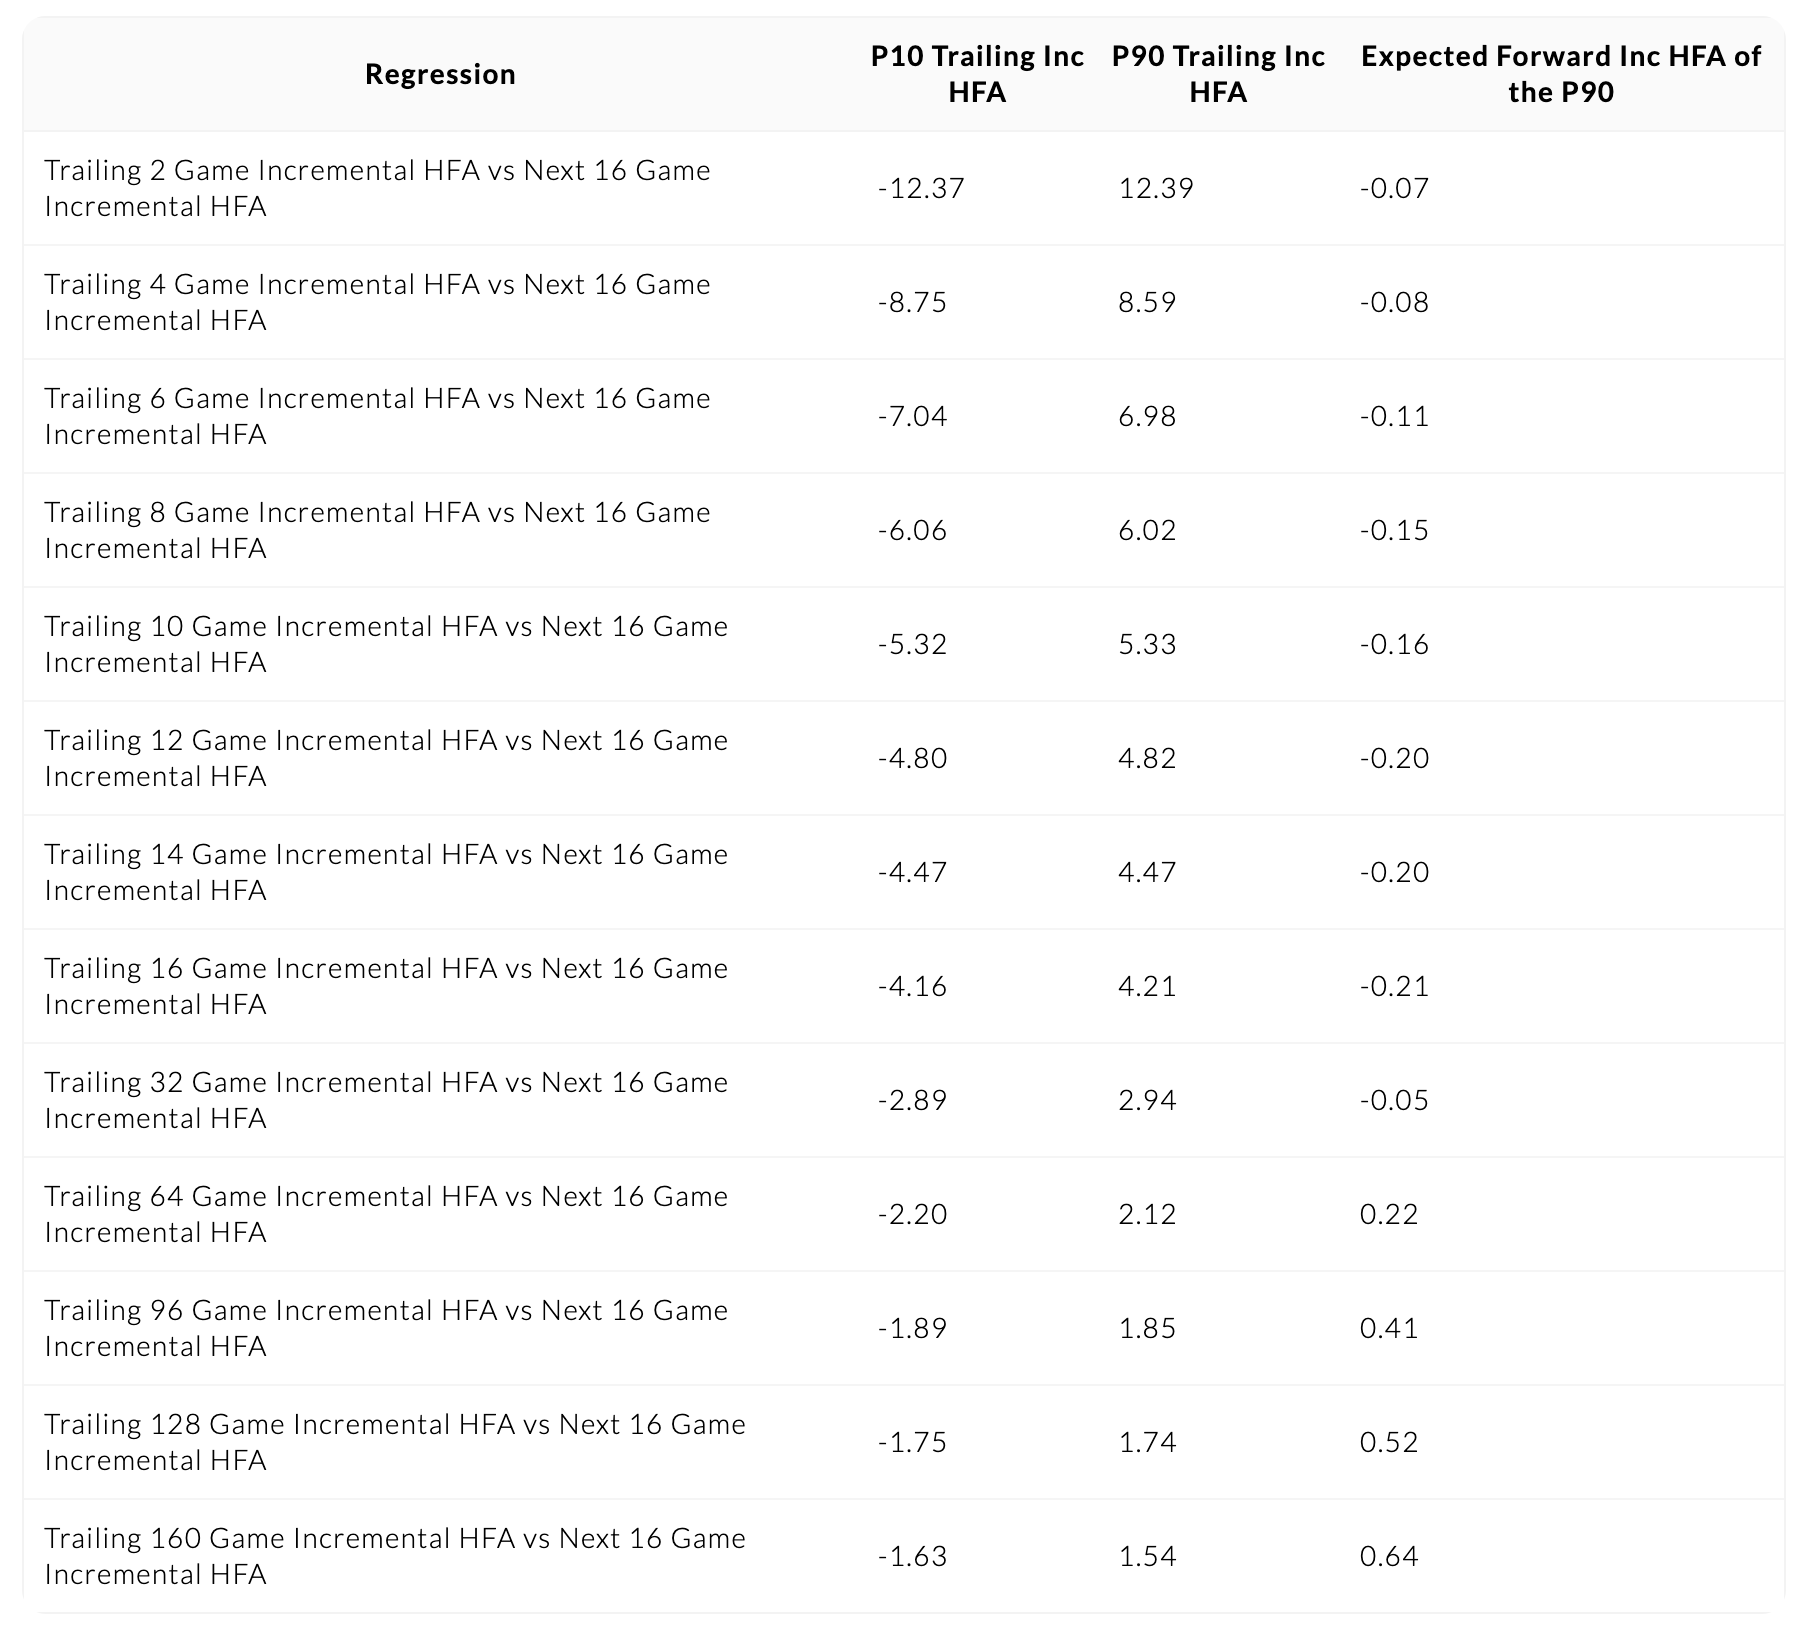
Over longer time windows, the slope does increase, but observed incremental HFA itself moves towards zero as time smooths out the variance. Looking across all trailing 10 season windows, the 90th percentile incremental HFA was just 1.5 points vs 4.2 for the shorter 1 season windows:

These factors result in nearly non-existent r-squared values in all regressions. Past HFA above expectation explains very little about future HFA above expectation. Even if we were to ignore the low r-squared values of these regressions, the highest performing HFA teams of the last two decades (1990 - 2009) would only be expected to perform about a half point better at home than the league average.
This isn’t to say that above average HFA is random. Rather, it means that past advantage is not indicative of future advantage. So while we may justly assess certain teams to be better at home than others, there is no reason to believe that they will maintain this elevated performance in the future.
Meta Factors - Travel Distance vs Divisional Matchup
Though the individual team dynamics that influence HFA may be fleeting, there are additional meta factors that could reliably influence HFA on a league wide basis. The list of potentially influential meta factors is long, and exploring it exhaustively is impractical for this initial look at HFA. Instead, this analysis will selfishly focus on the merits of travel distance and divisional opponent as these are feature differences in how 538’s Elo model and this site’s nfelo model calculate HFA.
538’s Elo model assigns 55 points of base Elo for home field and then adds 4 points of additional Elo for every 1000 miles traveled by the visiting team. Elo difference can be divided by 25 to calculate an approximate spread value, so the Elo model equates to 2.2 points of base advantage plus 0.00016 points for every mile traveled by the away team.
Regressing home point margin against away mileage traveled from 2002 to 2019 yields a slope of 0.0006 and an intercept of of 1.86, with the p-value of the slope resting on the edge of 0.05 significance:
Because 538’s model is not a linear regression and it is likely optimized over a longer data set, it’s not surprising that the optimal values differ from the regression. Generally speaking, this regression seems to confirm travel distance as an important factor.
However, it is important to highlight that divisions are organized geographically, and as a result, divisional games create selection bias in the travel distance variable:

Instead of using miles traveled, the nfelo model adjusts HFA based on whether or not the game is played between teams in the same division. Given the difference of away travel distance in divisional games, it’s not surprising then that a binary variable for divisional matchup is also significant when used in a regression for HFA:
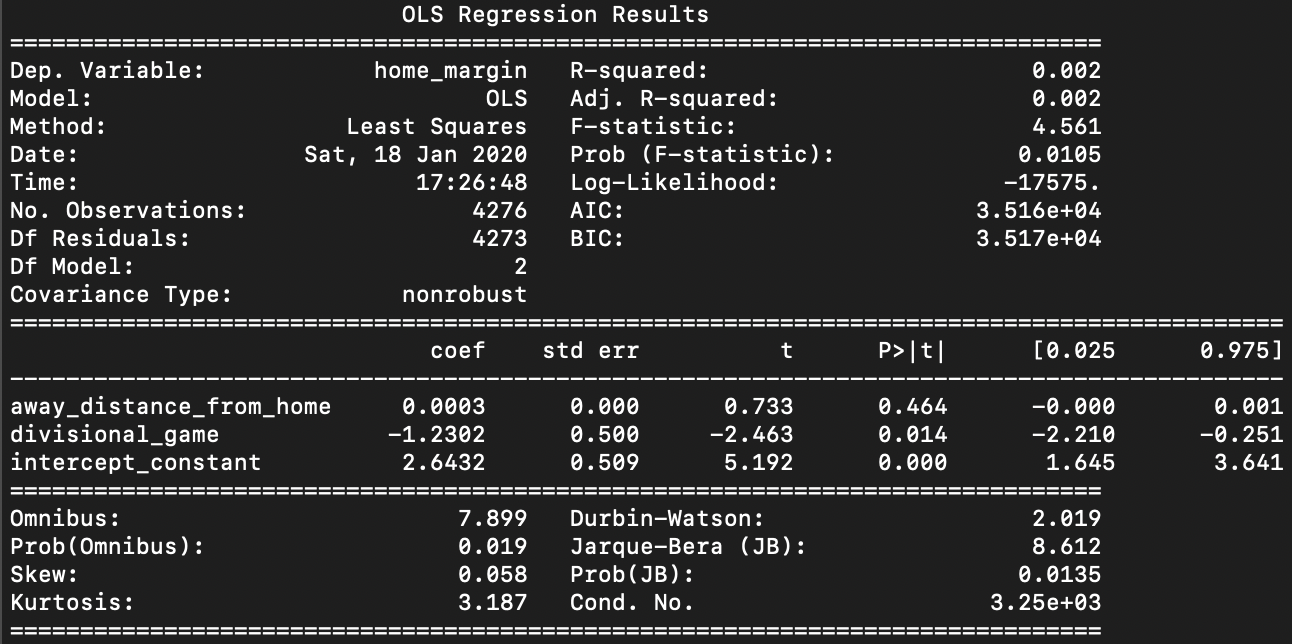
When the binary divisional matchup variable is introduced into the away distance regression, the p-value of away travel distance balloons:

In a model with such significant multicollinearity, the binary divisional variable seems to be the one to keep. Using this approach, base HFA should provide a 73.75 Elo advantage, which can then be adjusted down by 34 for divisional matchups.
Conclusion
Our understanding of HFA is anecdotal and unproven. Crowd noise, biased officiating, familiarity with stadium, and the benefit of more preparation time could all be plausible explanations and deserve further exploration. However, if we can’t explain why HFA exists to begin with, we shouldn’t have great confidence in our ability to predict what it will do in the future.
In the end, we can only model what we know with decent certainty--HFA is lower today than it was in the past and when divisional opponents play each other, HFA should be adjusted down.

@greerreNFL
NFL Analytics and Betting
Follow