Weighted EPA Methodology & Performance
September 5th, 2020 / Weighted EPA // Prediction // Modles // Expected Points Added // EPA /
Summary
WEPA is a framework that weights EPA to improve its predictive power
The goal of WEPA is to use publicly available play-by-play data to create an open source model that is free, reproducible, and more predictive than proprietary alternatives
The 2018 WEPA proof-of-concept suffered from overfitting and used forward looking data to train, resulting in an unreliable model
This post addresses these issues while improving the model through an expanded dataset and feature group
The new WEPA model is substantially more reliable and predicts future point margin better than current proprietary alternatives like DVOA
What is WEPA
WEPA stands for Weighted Expected Points Added. WEPA attempts to improve the predictive power of EPA by increasing and decreasing the prominence of certain types of plays when calculating EPA. Plays that impact outcome, but do so randomly (i.e. a recovered fumble) are discounted, while plays that predict future performance are overweighted (i.e a team’s performance when the game is close).
The WEPA framework was originally proposed in this post along with this illustration:
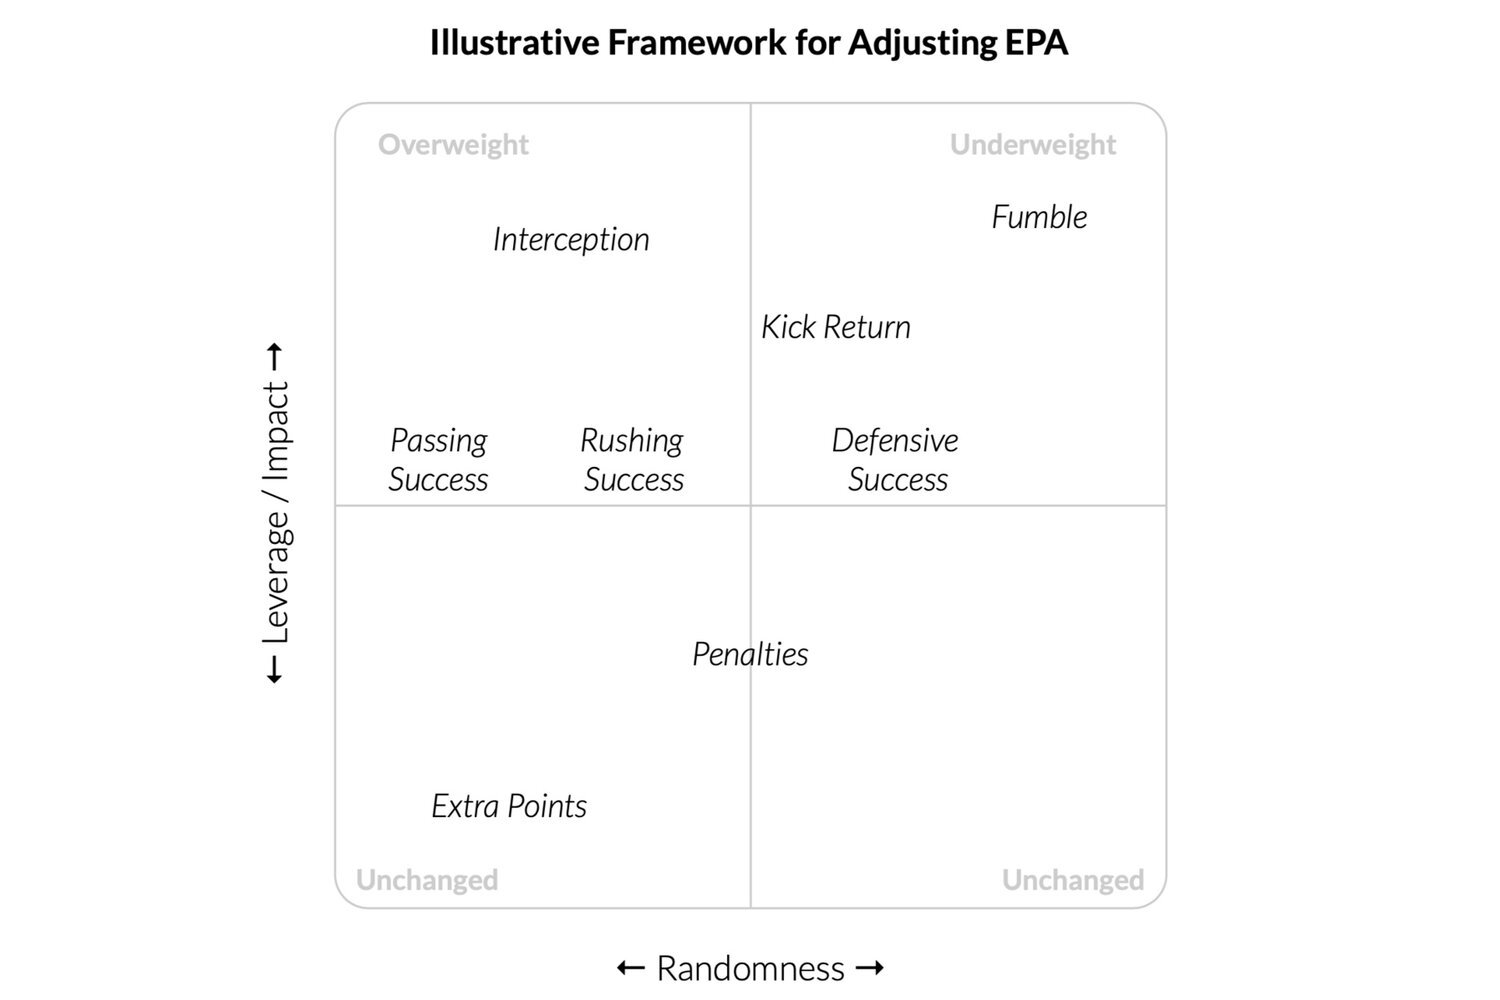
While the plotting of play types is not accurate in the illustrative example above, it does provide a good summary of the concept.
The initial WEPA analysis used weights to increase the predictive power of EPA by 14%. This improvement made WEPA more predictive than DVOA, which is one of the most widely used quantitative measure of NFL team performance.
There were, however, flaws in this analysis. Predictiveness in this context was measured by a metric’s out of sample (OoS) R-Squared (RSQ) over half seasons. A team’s WEPA performance over the first 8 games of the season was used to predict their point differential over the last 8 games of the season:
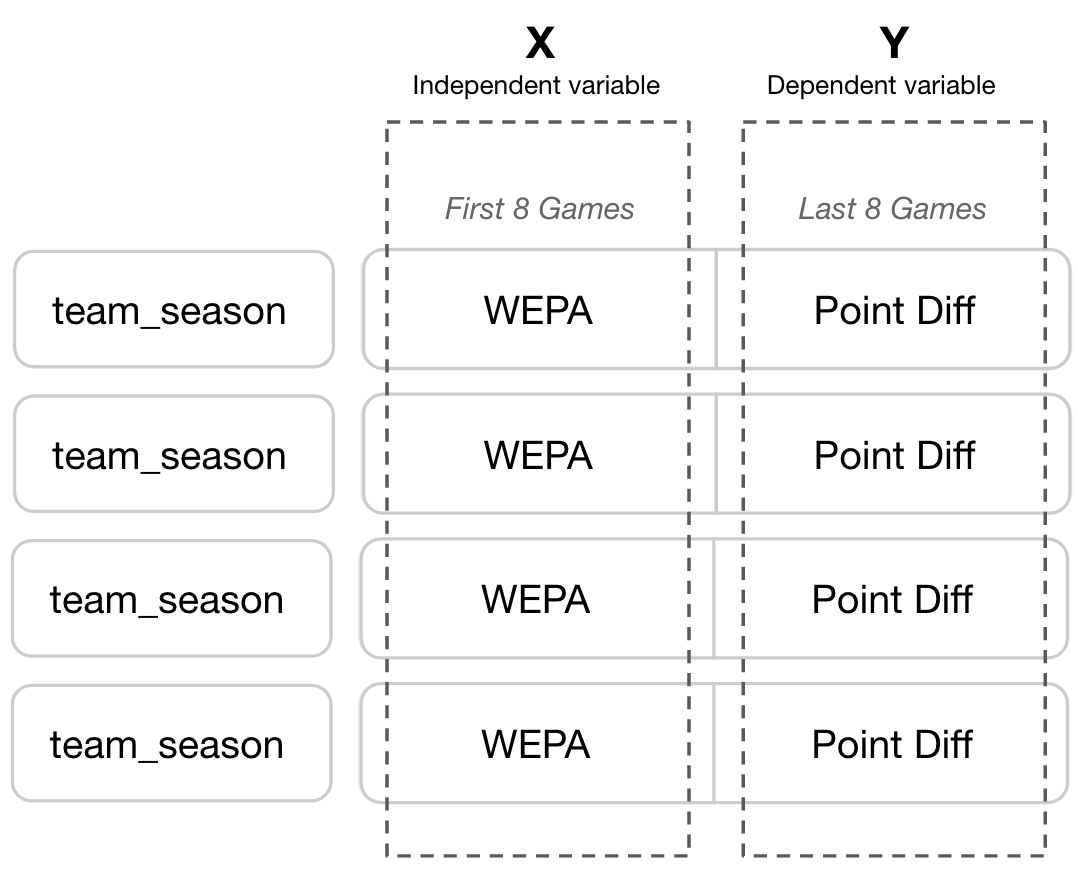
By selecting weights that maximized OoS RSQ across the dataset, WEPA introduced significant overfitting risk and used future data to inform past predictions. WEPA chose weights that happened to maximize the 2009 - 2018 dataset’s RSQ. Not only were these weights not guaranteed to be useful past 2018, they weren’t useful within the dataset itself as predictions for a season like 2012 were informed by data from 2016.
What is the Goal of WEPA
The goal of WEPA is straightforward--use publicly available play-by-play data to create an open source model that is free, reproducible by anyone, and more predictive than proprietary alternatives.
While the original WEPA analysis introduced an interesting framework for achieving these goals, it did not actually introduce a usable model for predicting future performance. The work presented here sets out to achieve these goals through the following:
Leverage more data -- Since WEPA’s introduction, the publicly available play-by-play dataset expanded from 10 seasons (2009 - 2019) to 20 seasons (1999 - 2019). WEPA 2.0 uses this expanded dataset to enable more robust training and to explore potential non-stationary trends. As the game of football changes, it’s not unreasonable that the ideal WEPA weights would change too.
Identify more features -- The original WEPA framework considered a relatively narrow set of play types and events. WEPA 2.0 explores additional features and incorporates those that provide predictive signal.
Use backward looking data only -- While the original WEPA framework fit weights to the entire dataset, the new process uses multiple validation methods that either withhold data for testing or train against backward looking data only.
Identifying New Features
Though optimizing RSQ for the entire dataset is problematic for measuring model performance, it can be useful in identifying features with potential signal. To identify this potential, a significantly expanded set of features were optimized individually to maximize OoS across three datasets--All seasons, 1999-2009 seasons, and 2009-2019 seasons. “Lift” measures the lift of the weighted EPA over an unweighted (i.e. baseline) EPA:
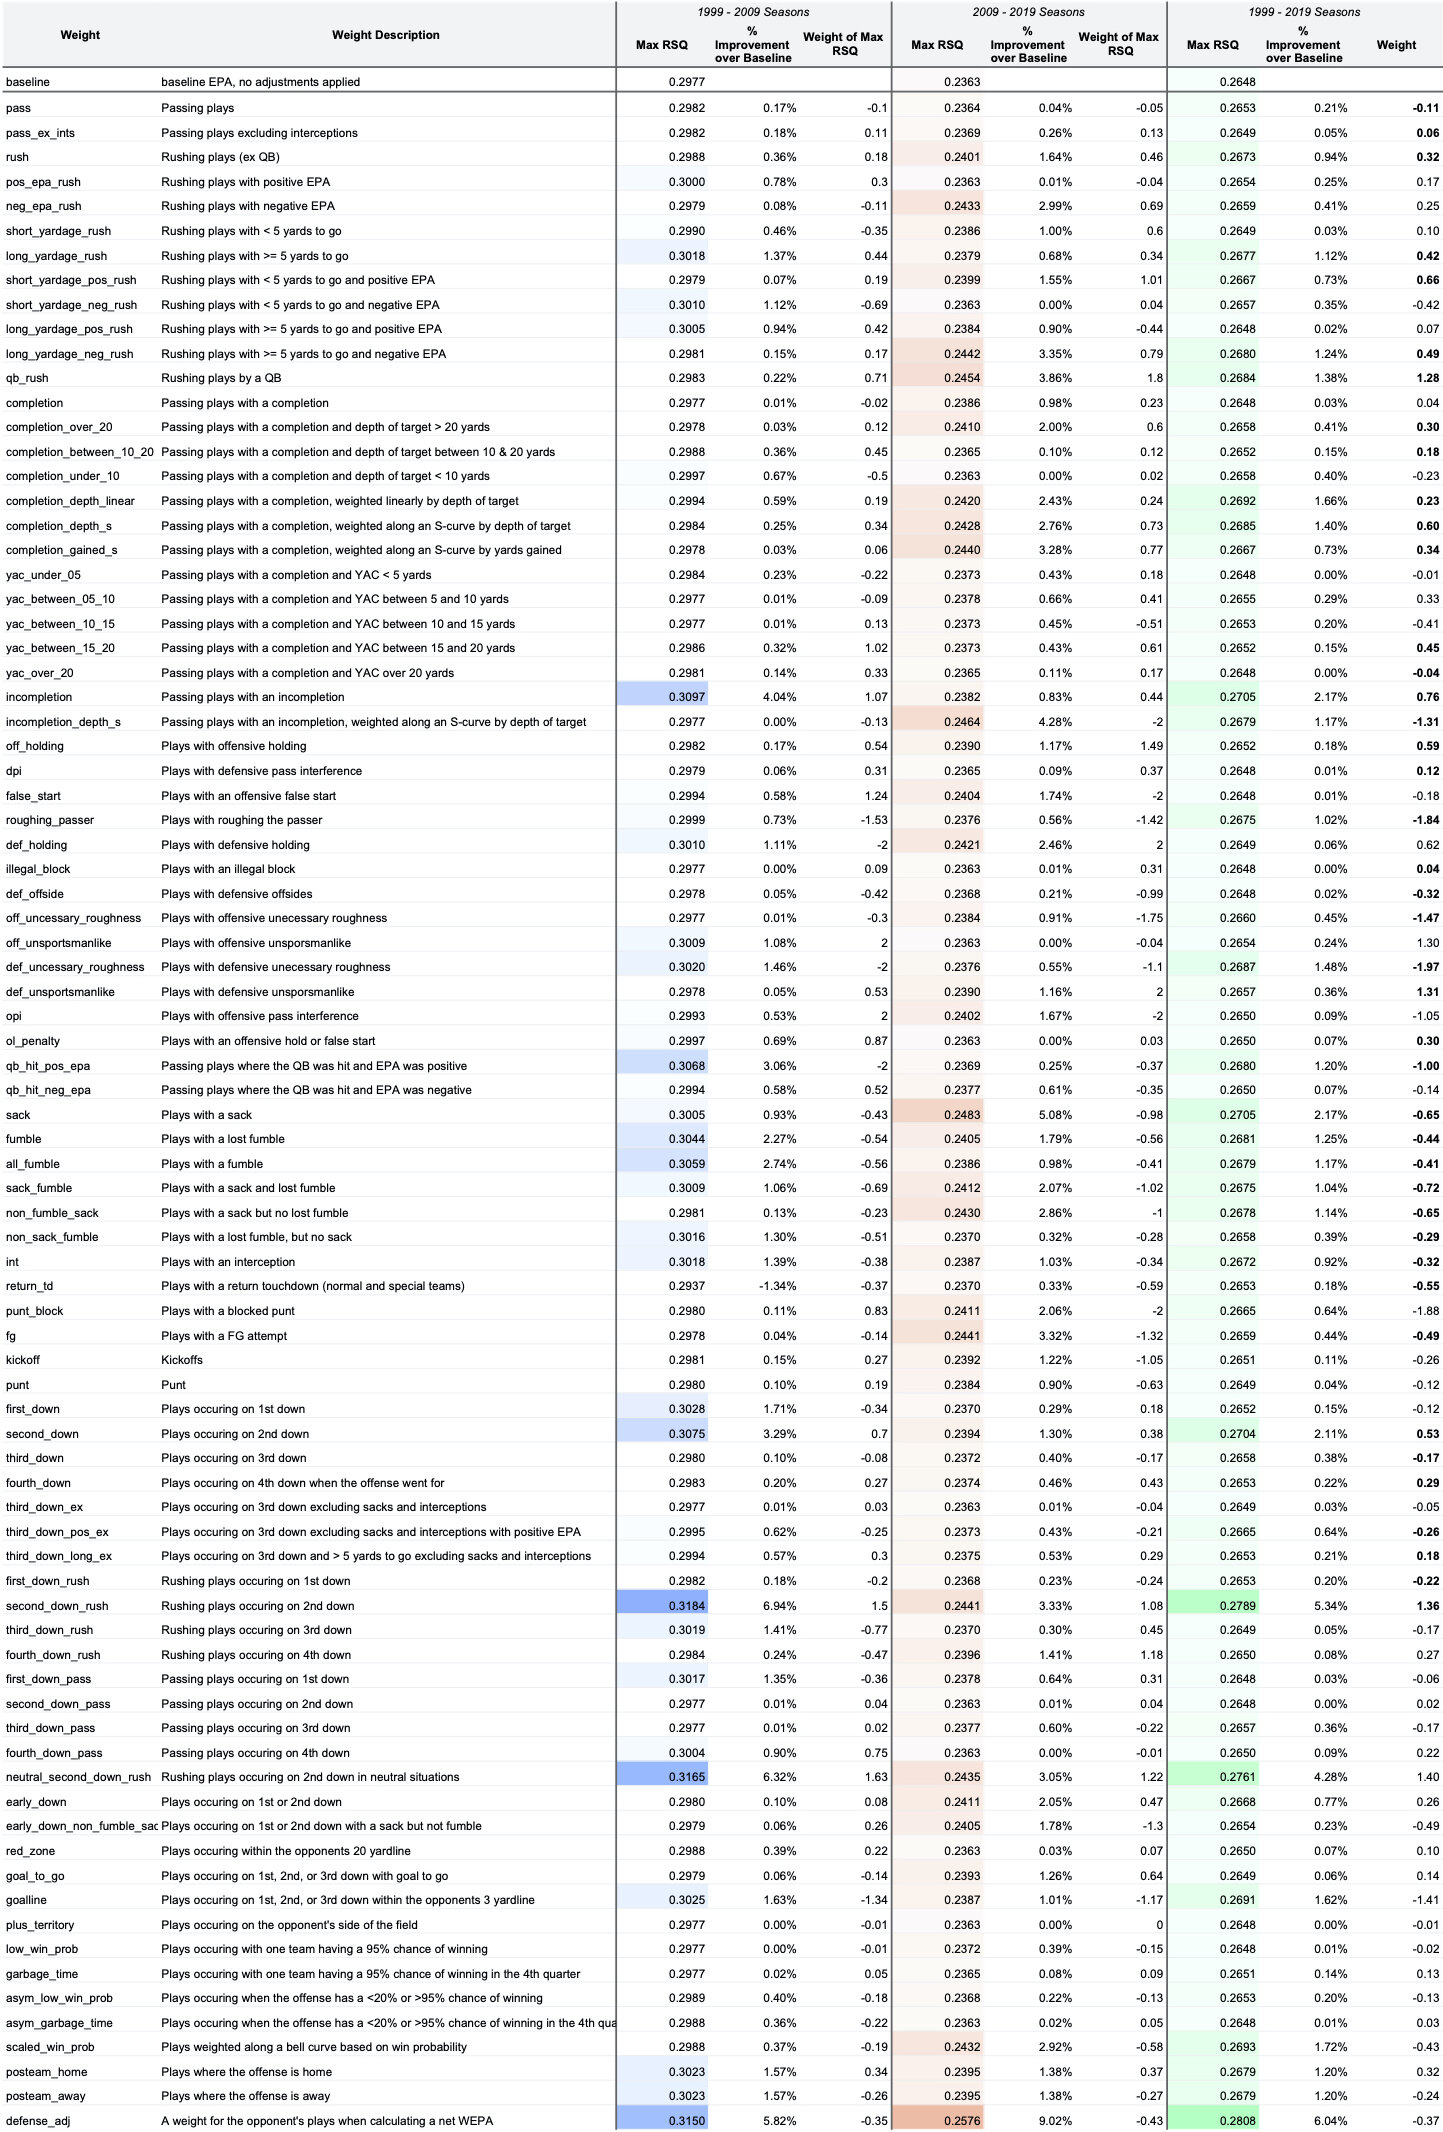
Features that performed well across all three datasets were considered for inclusion. While most features are self-explanatory, two deserve specific extrapolation.
Asymmetric & Scaled Win Probabilities
As win probability nears certainty, teams adjust play style. A team with the lead will run more to shorten the game and play more conservatively on defense to prevent game changing big plays. Conversely, a team with a low win probability will pass significantly more on offense in an attempt to get back in the game quickly without sacrificing game clock.
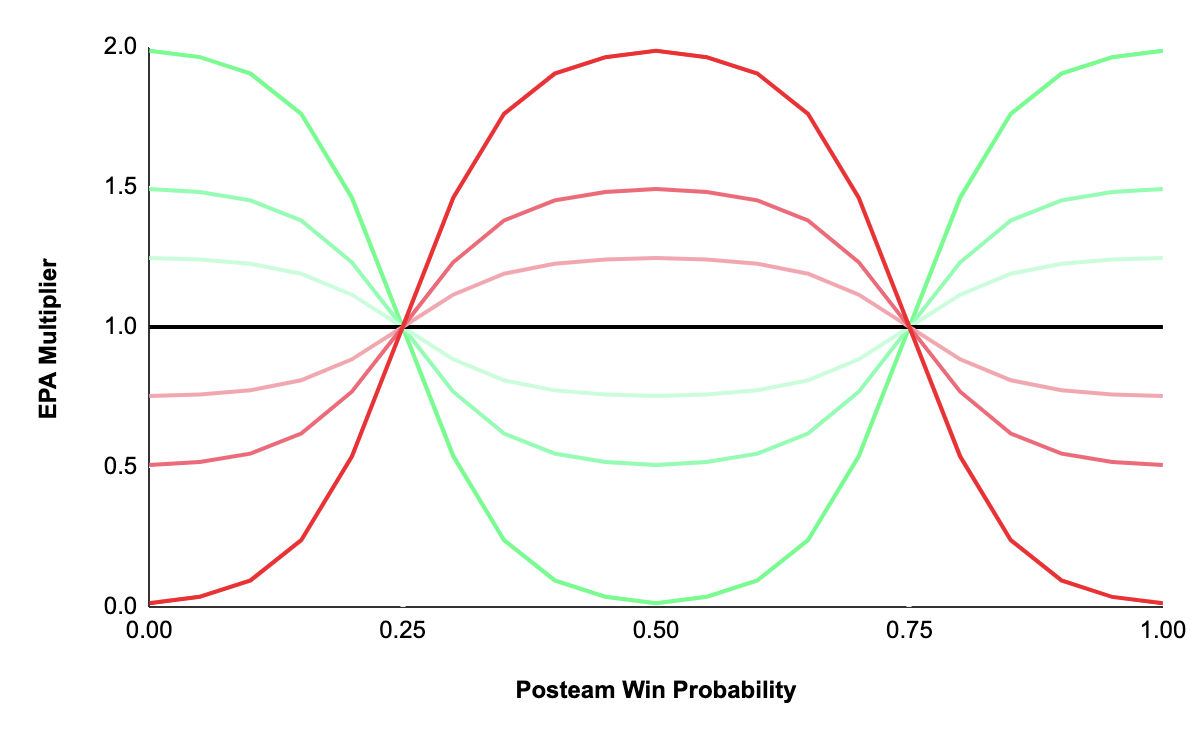
With teams optimizing for victory rather than simple point accumulation, EPA accrued during this period is less likely to be predictive of future performance. This EPA should be discounted, but at what point? Teams don’t dramatically shift playing style once the game goes from a 94% win probability to a 95% win probability. Playstyle exists on a spectrum, and as it turns out, so does the best over/underweight for maximizing OoS RSQ:
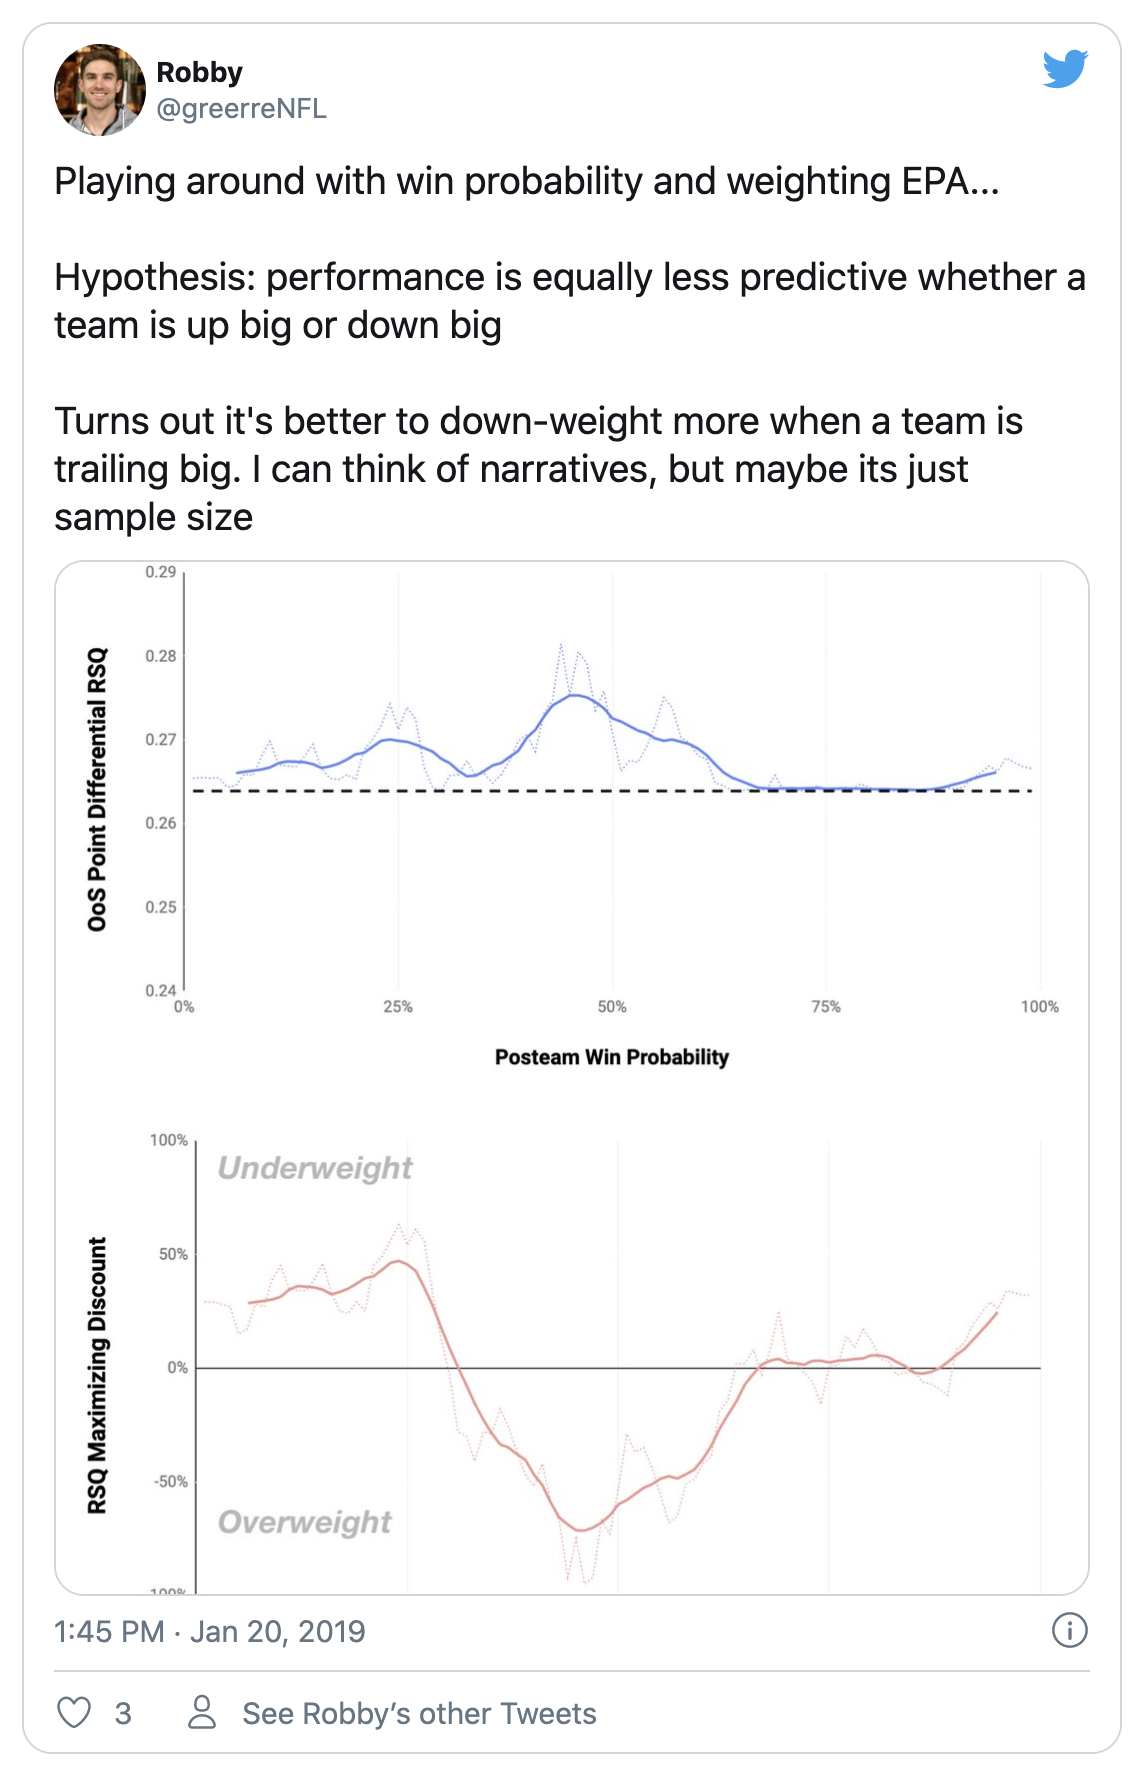
Plays occurring at a 50% win probability should be weighted slighter higher than plays at a 49% win probability, which should be weighted slightly higher than those at 48% and so forth. The “scaled win probability” feature scales its weight along a bell curve. A value of -2 completely discounts plays at the end of the tail (Red Line), while a weight of 2 completely eliminates plays in the middle (Green Line): Weights between -2 and 2 mute these extremes:
It is also important to note that features constructed with typical “garbage time” definitions do not improve OoS RSQ with nflfastR’s updated EPA model the way they did with nflscrapR’s. This point likely deserves more exploration, but is out of scope for this analysis.
Scaled Completions and Incompletions
A variety of past research has shown a team’s depth of target to be fairly stable even though the completion rate of those passes may vary across games:
An incompletion generates the same negative EPA regardless of depth of target, thus it may be valuable to reward teams that are able to complete deep passes or penalize teams less when they miss a deep pass. Like the scaled win probability feature, the scaled features for completions and incompletions scale the weight with depth of target. Using a negative value on incompletions (Red Line) will penalize a team more for a short incompletion while eliminating any penalty for missing on a deep attempt. Conversely, a positive value (Green Line) used for completions would give a team even more EPA when they complete a deep throw and substantially discount EPA when they complete a short pass:
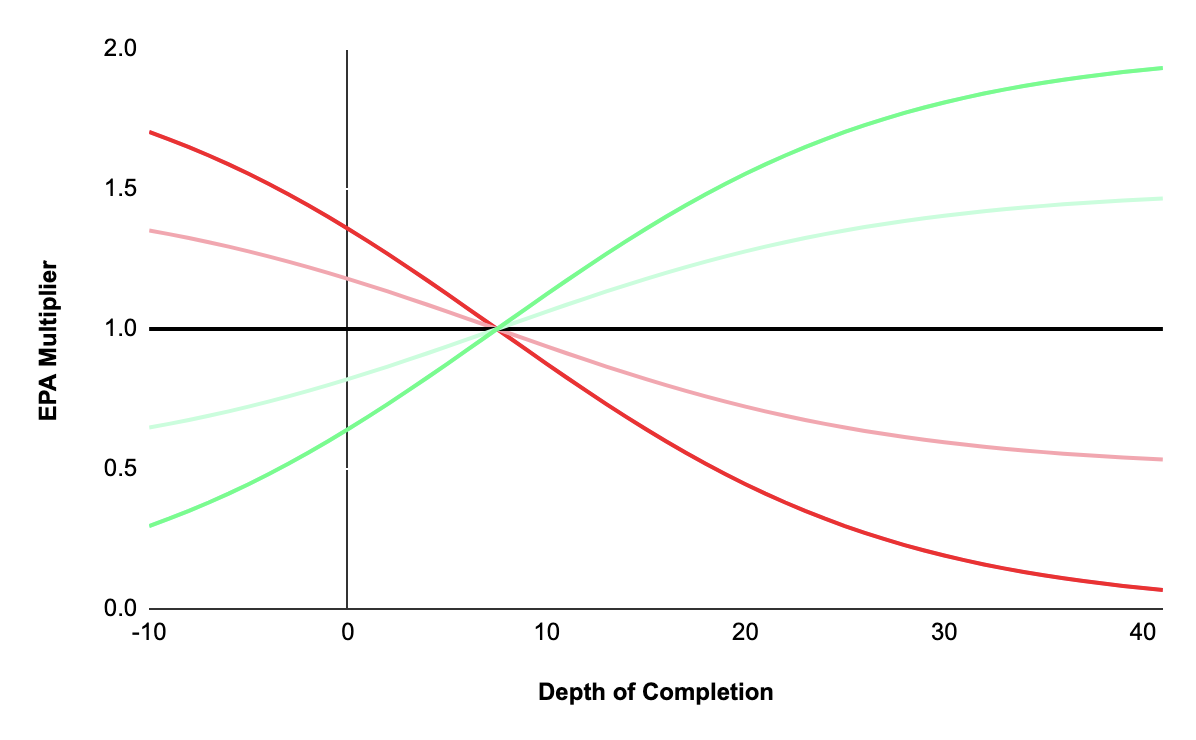
An additional note, depth of target is only available after 2006, so these features do not have impact on WEPA prior to that season.
Feature Selection
Features with large lift over baseline EPA served as the best starting points for inclusion in the model. To help prevent potential overfitting, features with large impact and similar weights across both the 1999-2009 and 2009-2019 data set were given top consideration--a feature with high impact but substantially different weights across both datasets (i.e. defensive holding) were thought to likely be noise rather than signal. The initial features chosen were:

Note that completion_depth_s and incompletion_depth_s replacing incompletion and completion_gained_s post 2006.
Measuring Performance
To avoid the issues in the original WEPA analysis, weights were trained using only backward looking data, and the performance of those weights was measured against only future looking data. To measure potential non-stationary effects, models were trained using a variety of backward looking window lengths (i.e. 1 season, 2, seasons, 3 seasons, etc). Weights from the RSQ optimized model were then used to calculate a WEPA over the next three seasons. The RSQ of the model was the RSQ of these weights over the forward looking data:
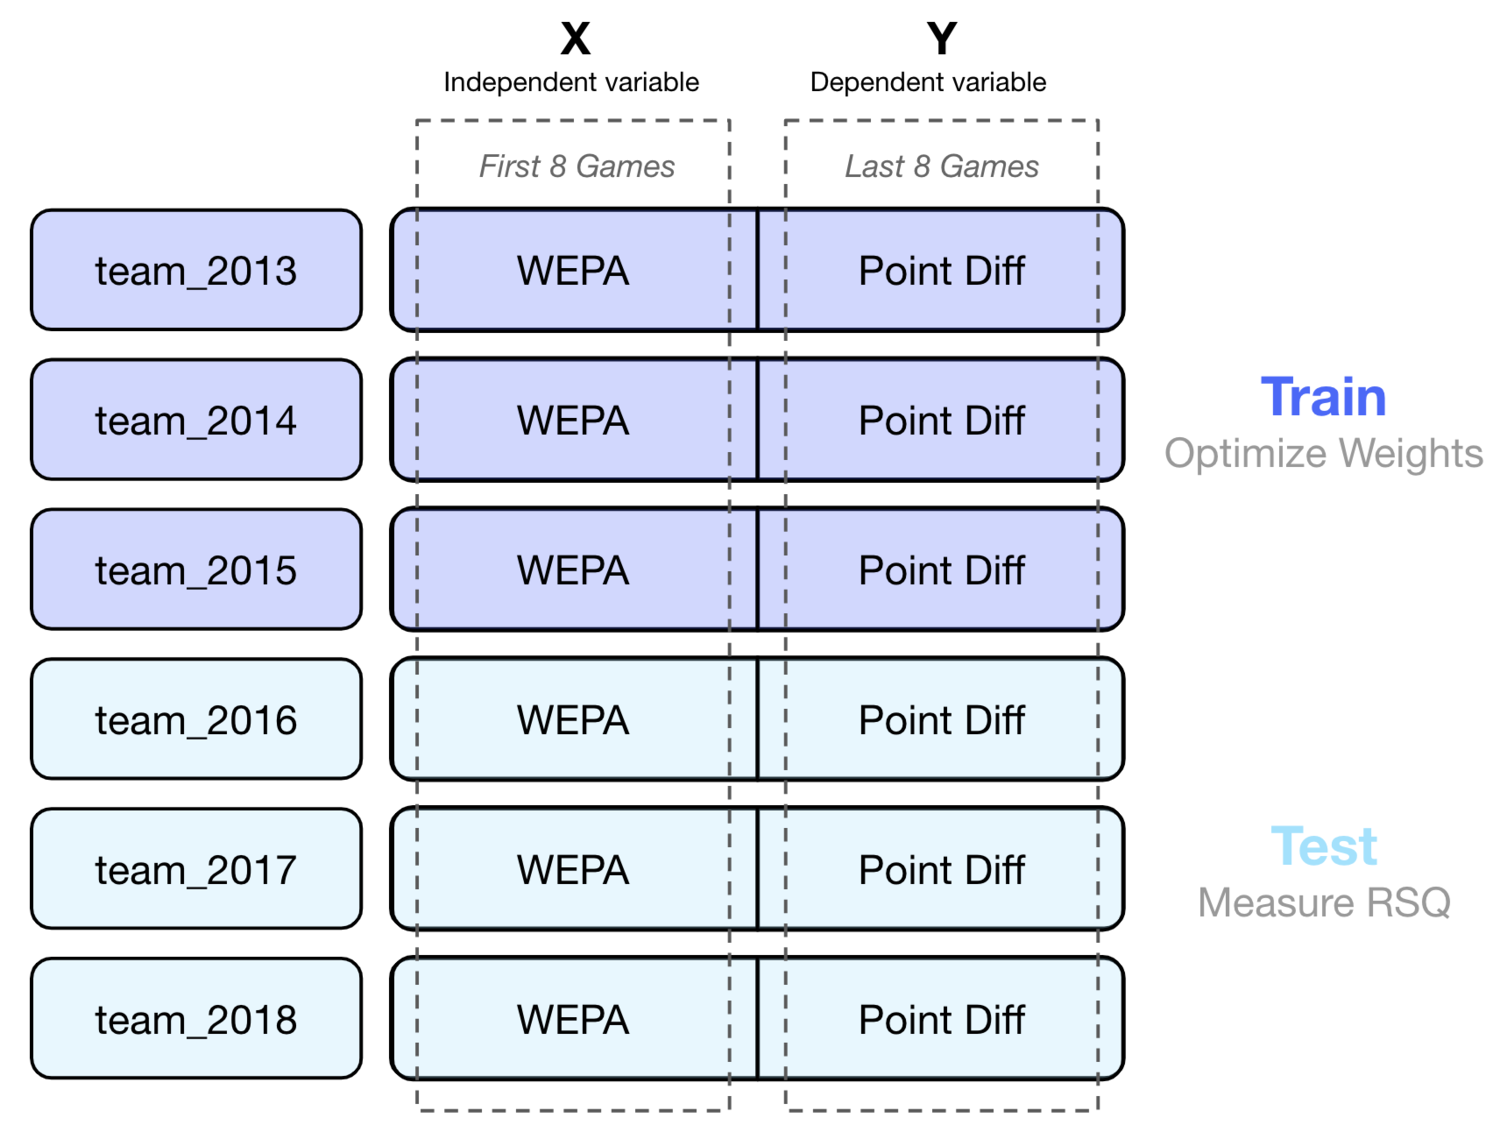
The example above shows a “2015 Season” model trained with three backward looking seasons of data. Note that the forward looking performance of a model labeled as the “2015 season” is calculated using data from the 2016, 2017, and 2018 seasons.
Using this methodology, it’s clear that having more training data is important, and likely outweighs any non-stationary effects. The table below shows models trained on a variety of backward looking window lengths with forward looking RSQ performance presented relative to the best possible window length for that season:
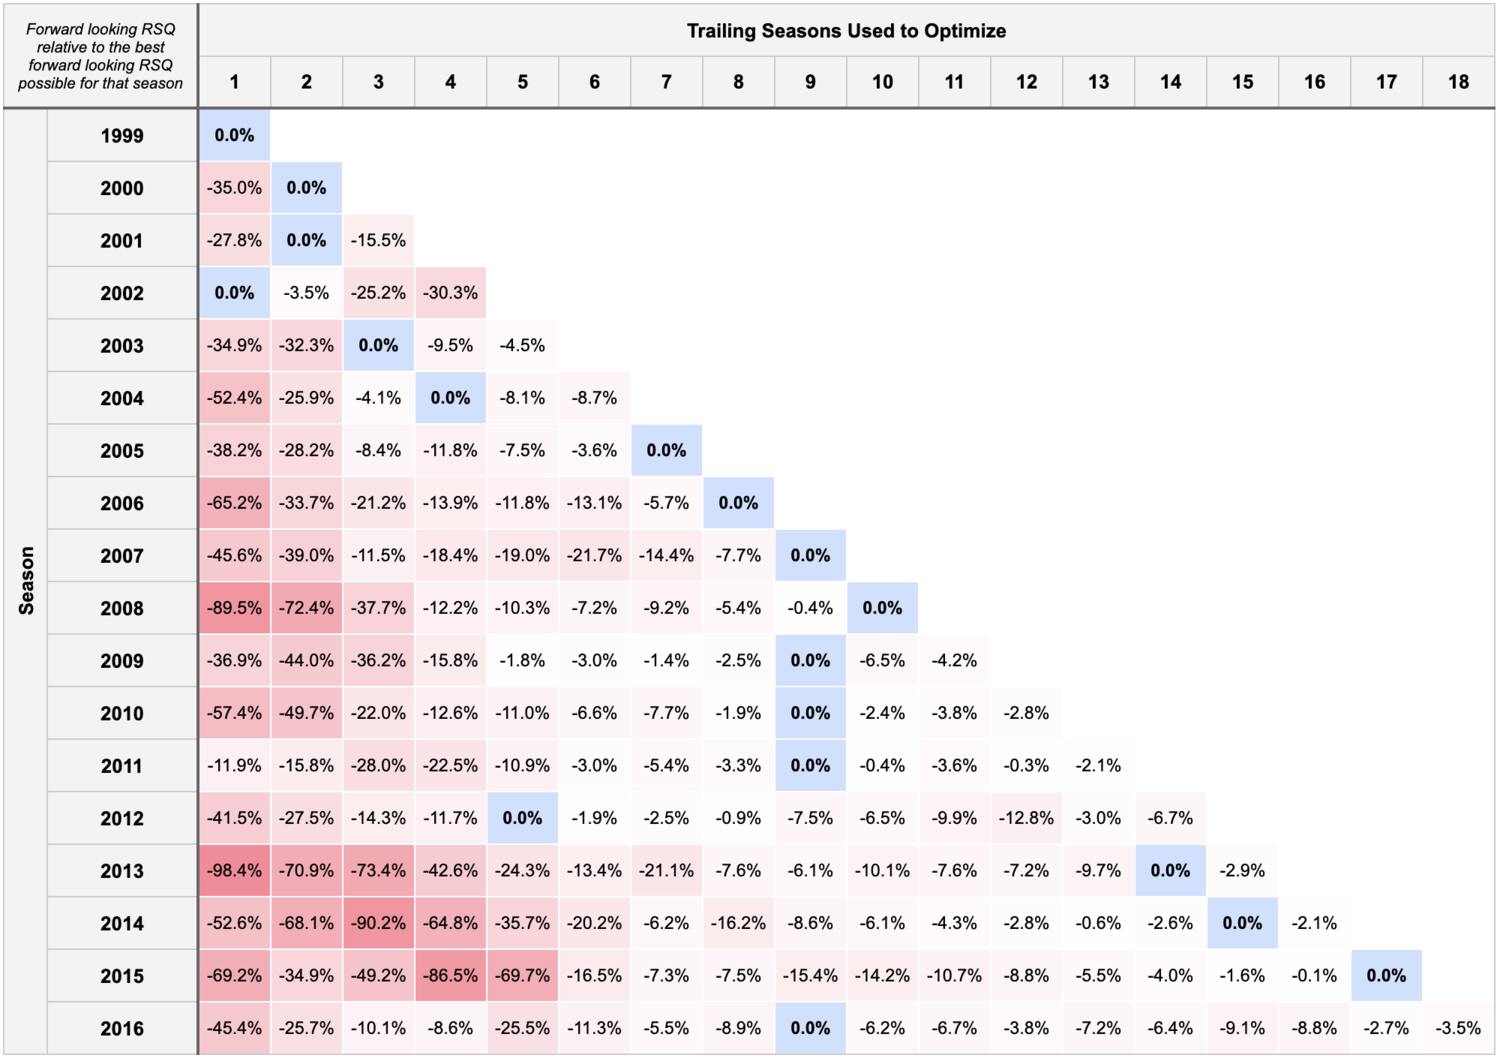
For example, the best “2013” model was the one trained with 14 seasons of data (2000 - 2013), with “best” defined as having the highest RSQ when those trained weights were used to calculate WEPA in the 2014, 2015, and 2016 seasons.
For nearly all seasons, the forward looking RSQ is maximized by taking the longest backward looking view possible.
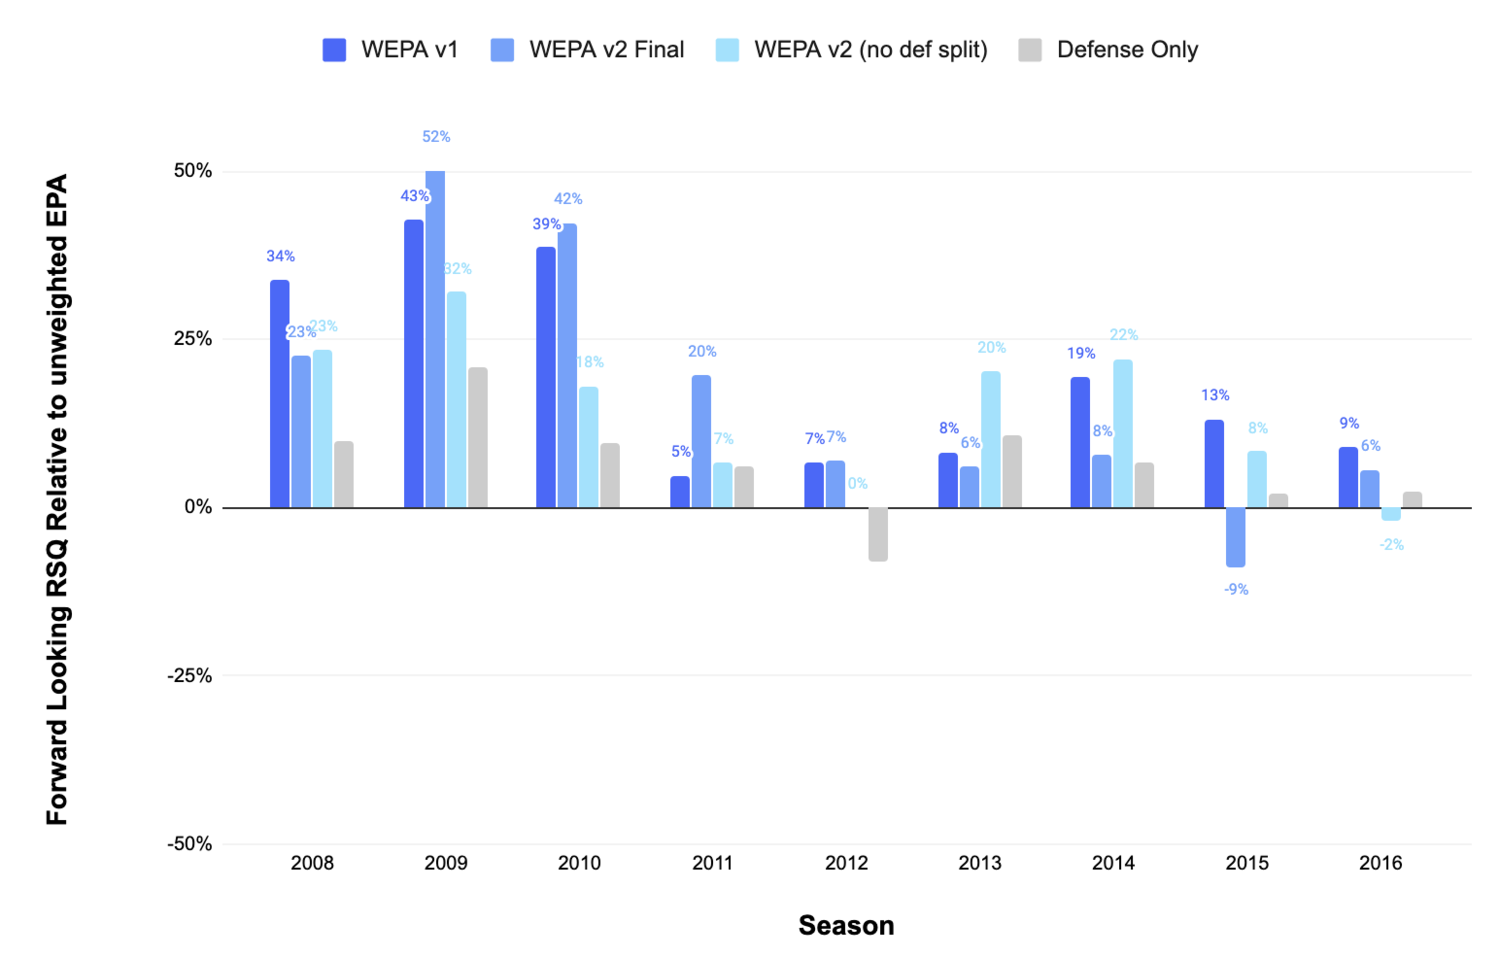
Predictably, forcing the model to use backward looking data significantly reduced its performance. This chart shows WEPA’s forward looking performance relative to EPA over the same window. WEPA v1 is the original WEPA model that incorporates forward looking data, while WEPA v2 represents a model trained only with backward looking data:
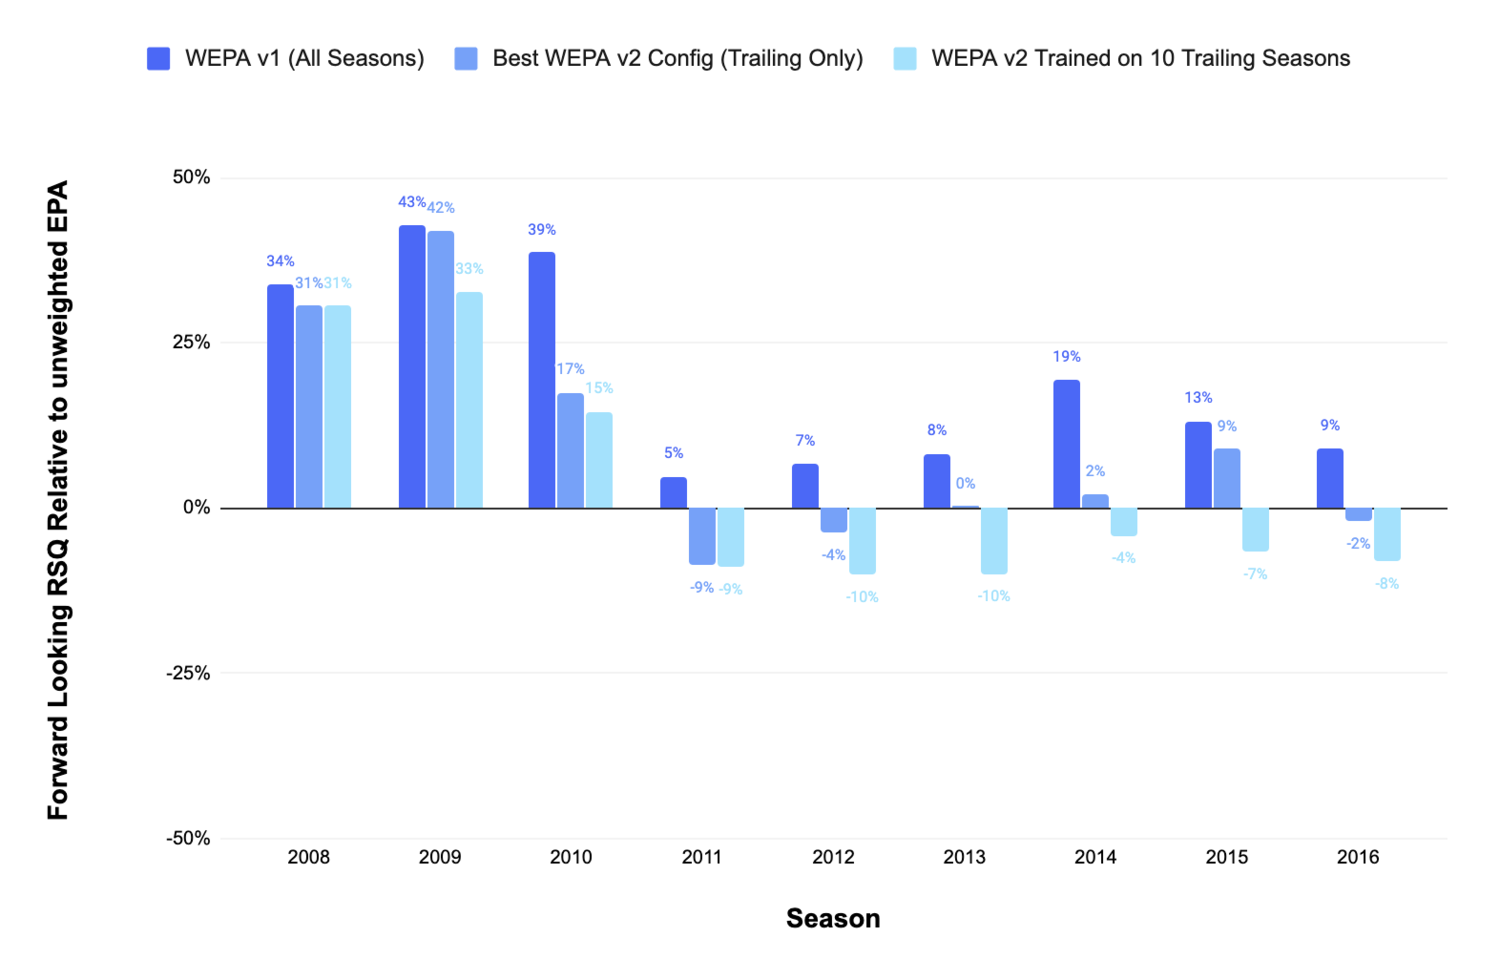
Even if we could cherry pick the ideal backward looking window length for training, WEPA 2.0 would not outperform EPA consistently.
The difference in performance between the original WEPA model and WEPA 2.0 is potentially explained by overfitting. While WEPA 2.0 lags on a majority of forward looking windows, it still performs consistently well on a backward looking basis:
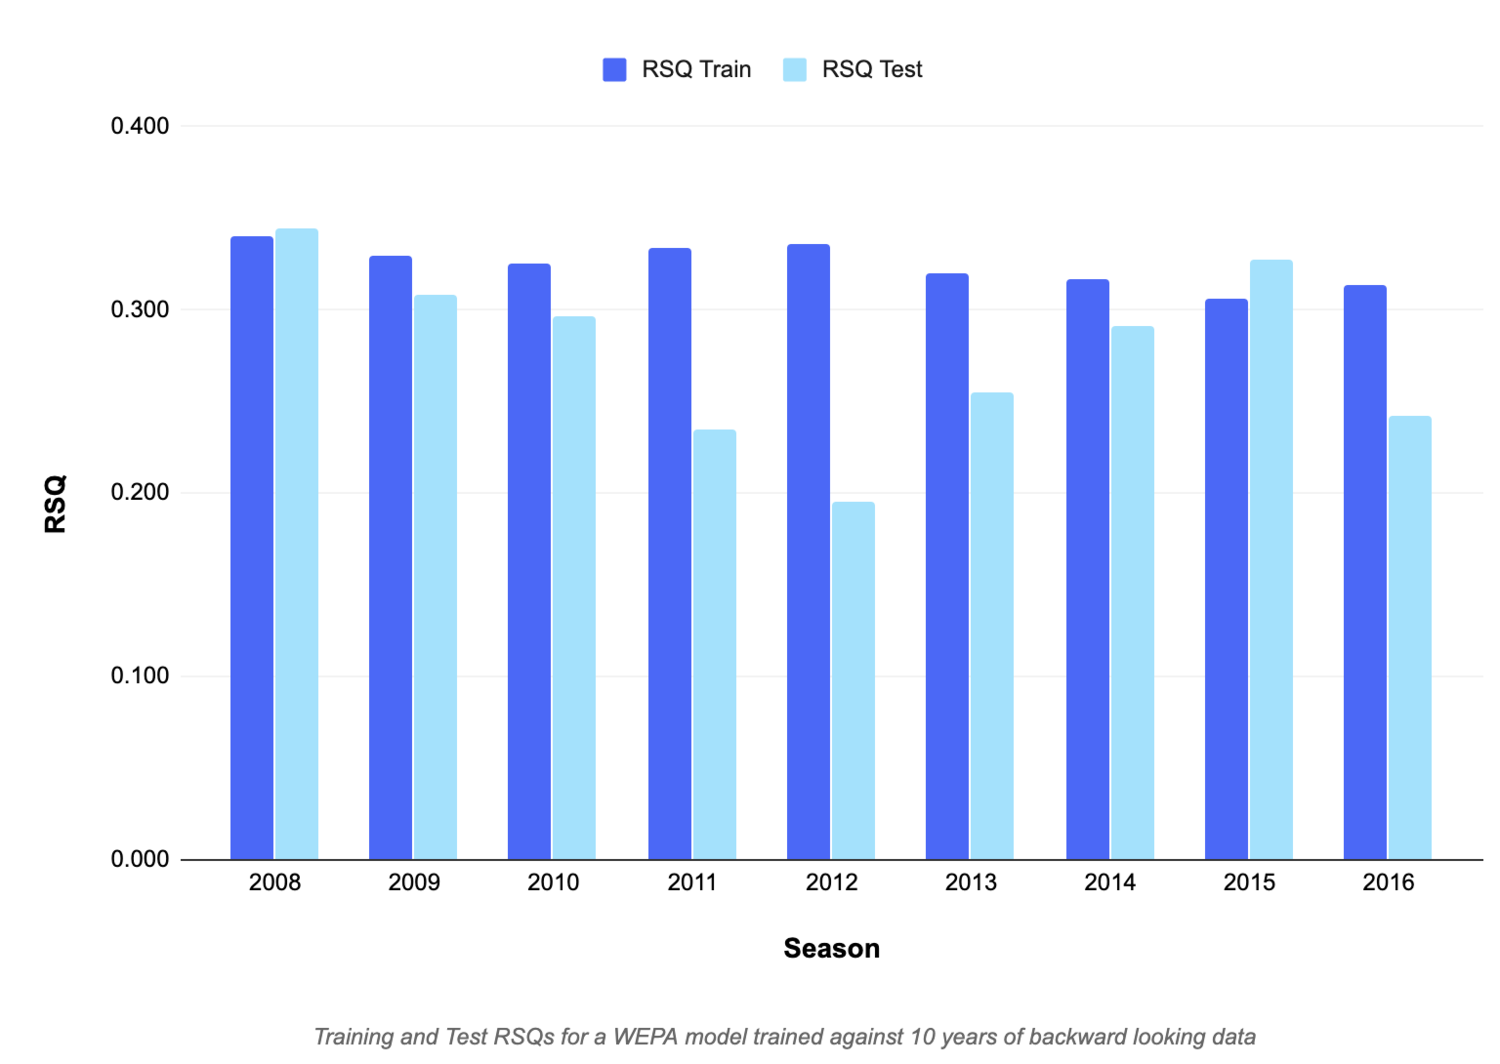
In effect, the weights that optimize the past are not the weights that optimize the future. Given that the issue persists even over longer look back periods that should be harder to overfit, feature selection seems to be a likely culprit.
Including more variables, which may or may not have real signal, gives the model greater flexibility to fit itself to past data. While this contortion allows the model to perform well over past data, it makes it less suitable for predicting the future.
WEPA is particularly susceptible to overfitting due to the interactions that exist between features. WEPA weights are not MECE--they overlap:
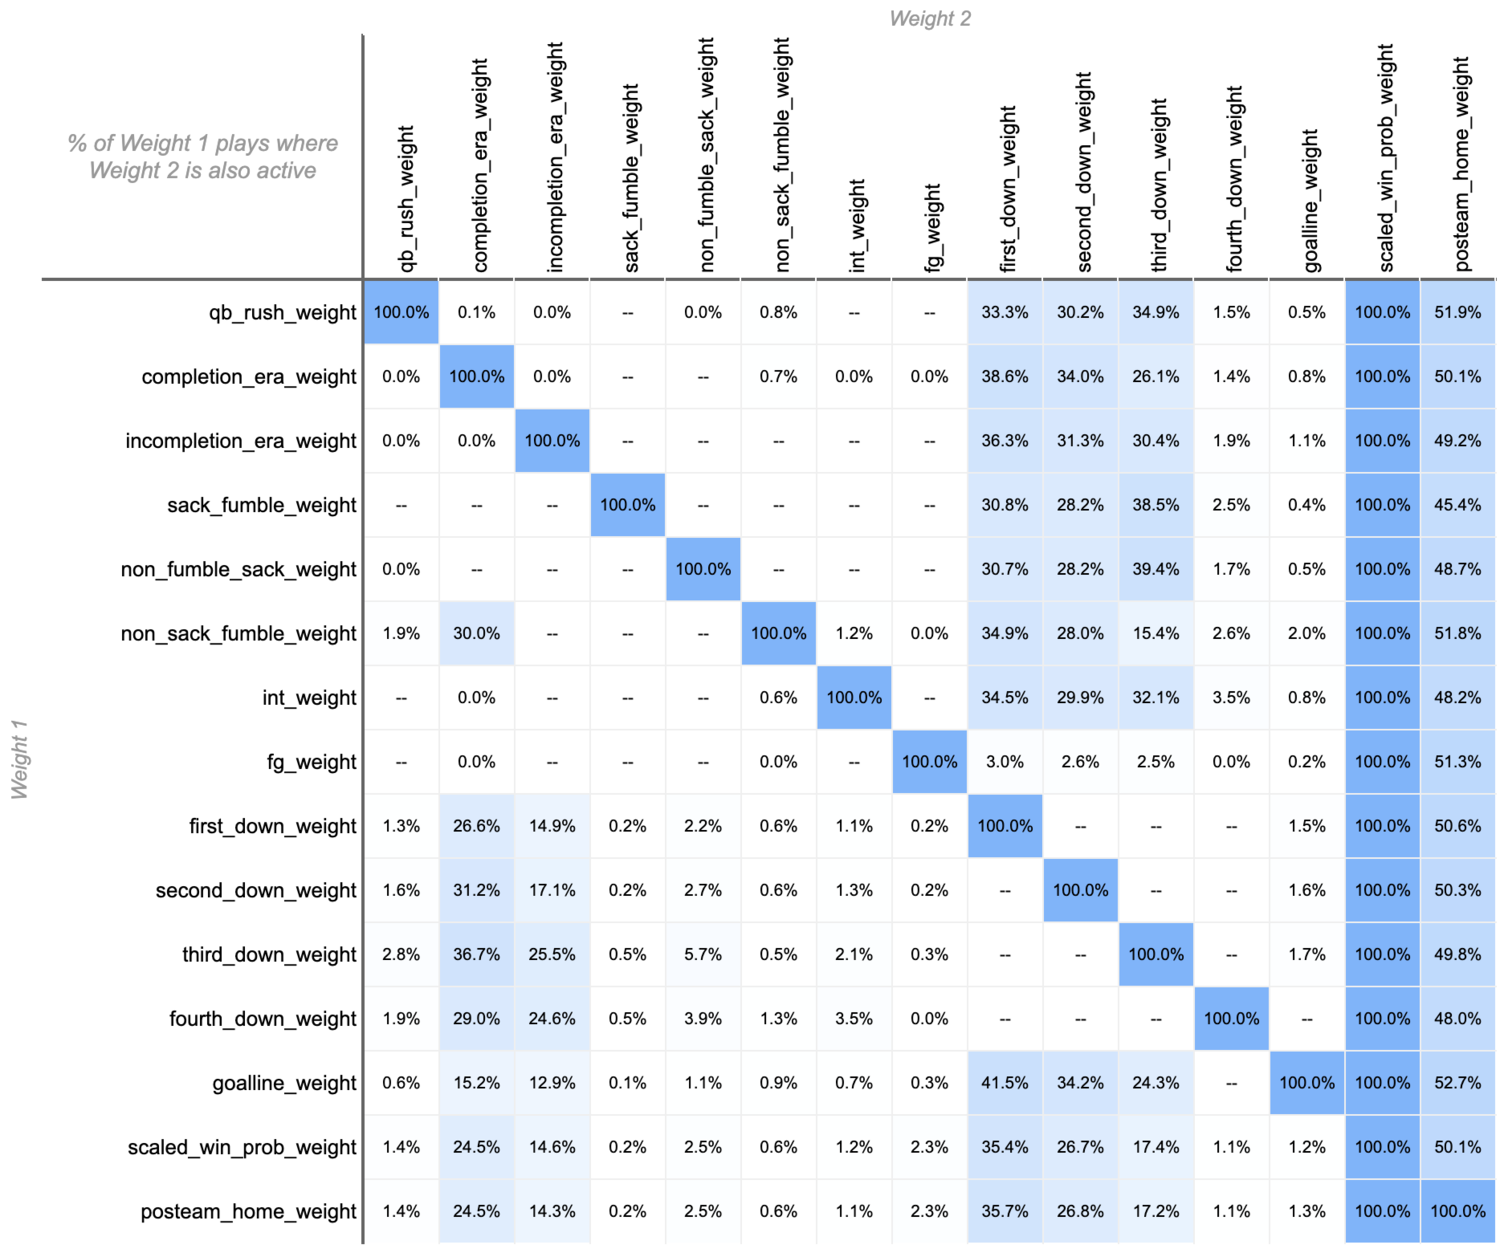
When weights overlap on a play, they are multiplied together. If two variables share an overlapping variable, they too become interlinked as any individual variable’s weight is optimized in the context of all other weights it overlaps with:
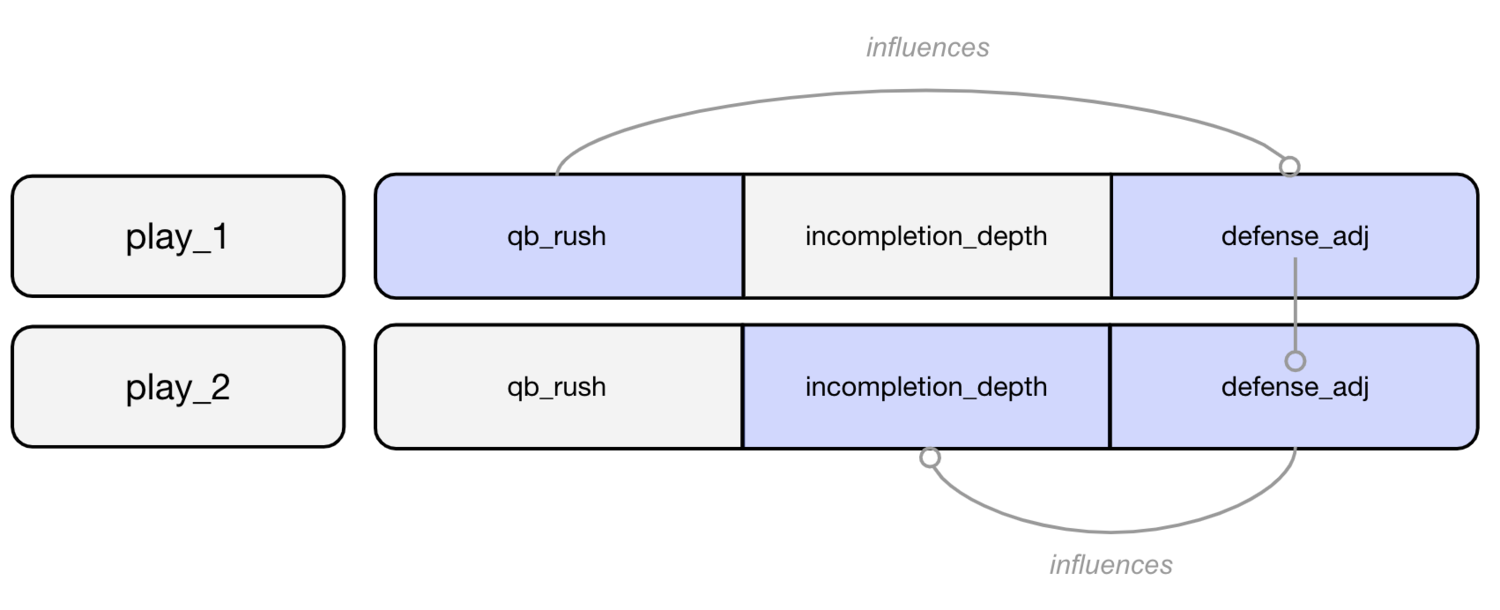
Two features that should be mutually exclusive (i.e. qb rushes and incompletions) are linked by the features they share. One feature that is more noise than signal can corrupt the predictive power of the other features.
By eliminating features that introduce overlap or that have more questionable predictive power based on the original feature exploration, the model’s forward looking performance is greatly improved.

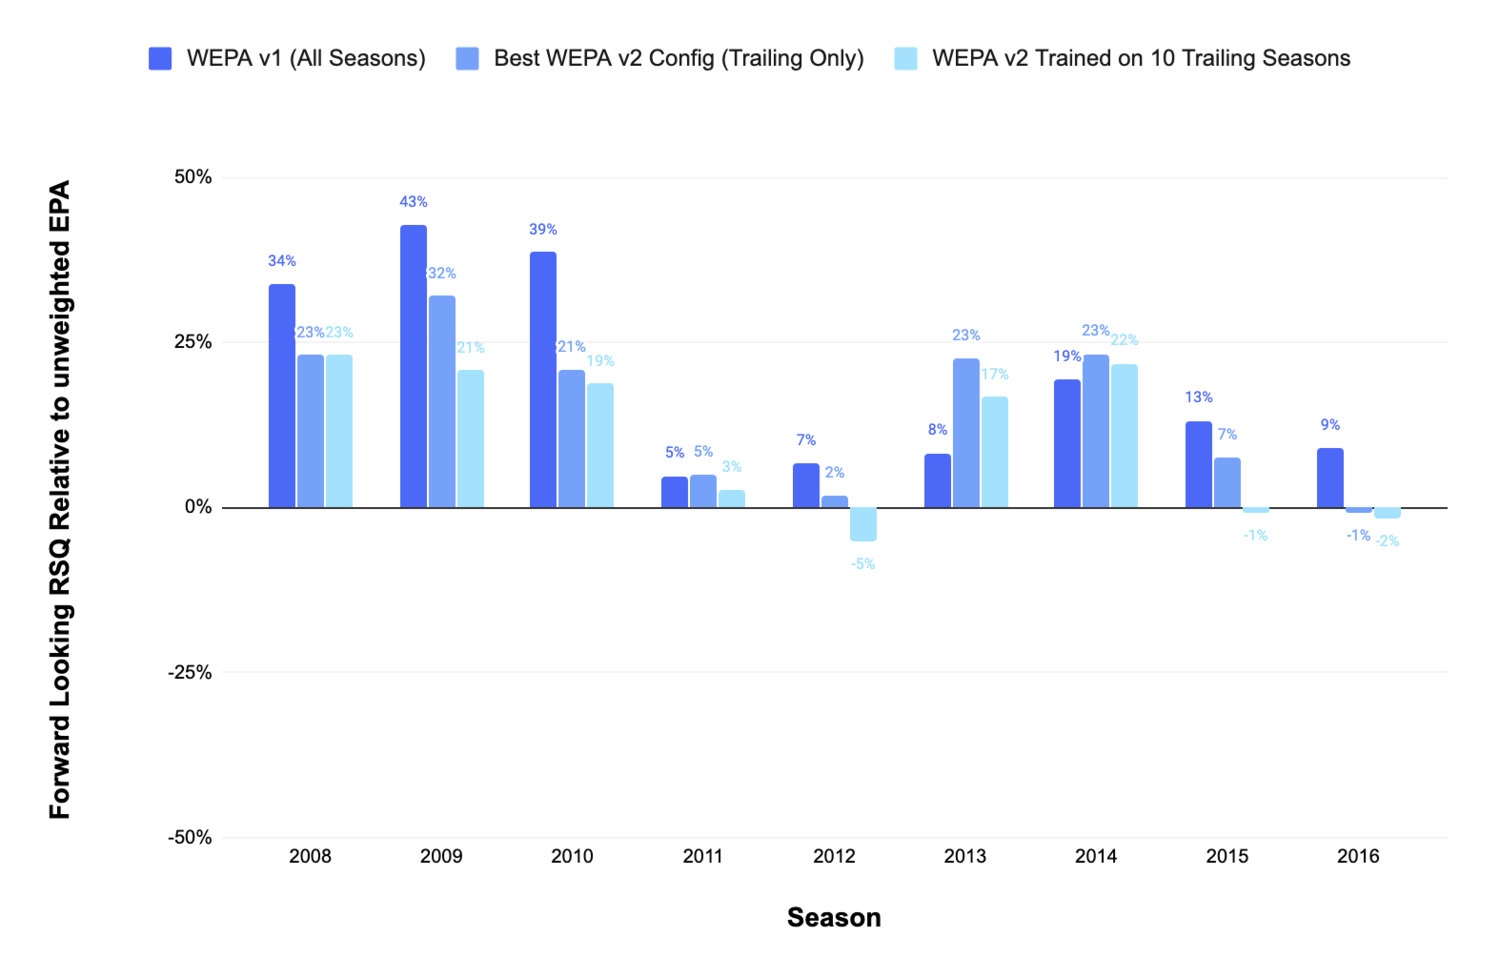
With the constrained feature set, WEPA outperforms baseline EPA in two-thirds of forward looking season groups, and in season groups that underperform, that underperformance is minimal.
It is, however, important to note the potential flaw in this approach to feature selection. While the model is trained on backward looking data, features are selected based on forward looking performance. Forward looking data is still being used in the fundamental creation of the model.
To mitigate this overfitting risk even further, a secondary validation method was used. Instead of splitting training and testing datasets based on time (i.e. A seasons back vs B seasons forward), seasonal team performance was randomly split into training and test data sets:
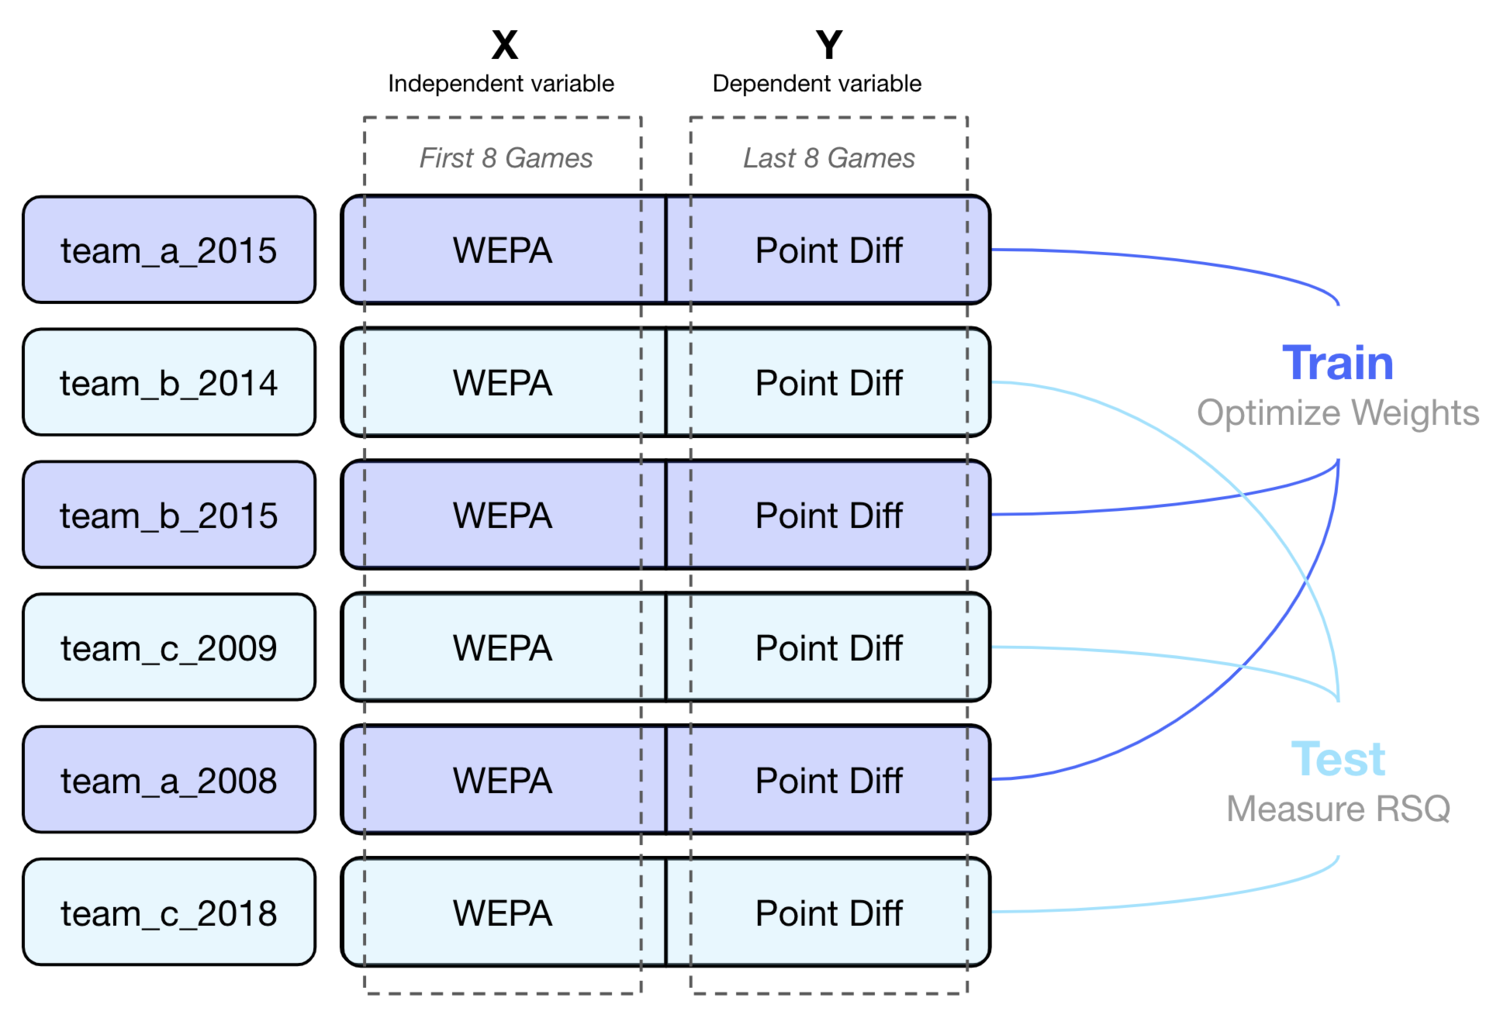
Because the data set is fairly small (fewer than 700 team_season observations), a fair amount of variance exists across random splits. As a result, this training and testing process was repeated 50 times with performance considered as a distribution:
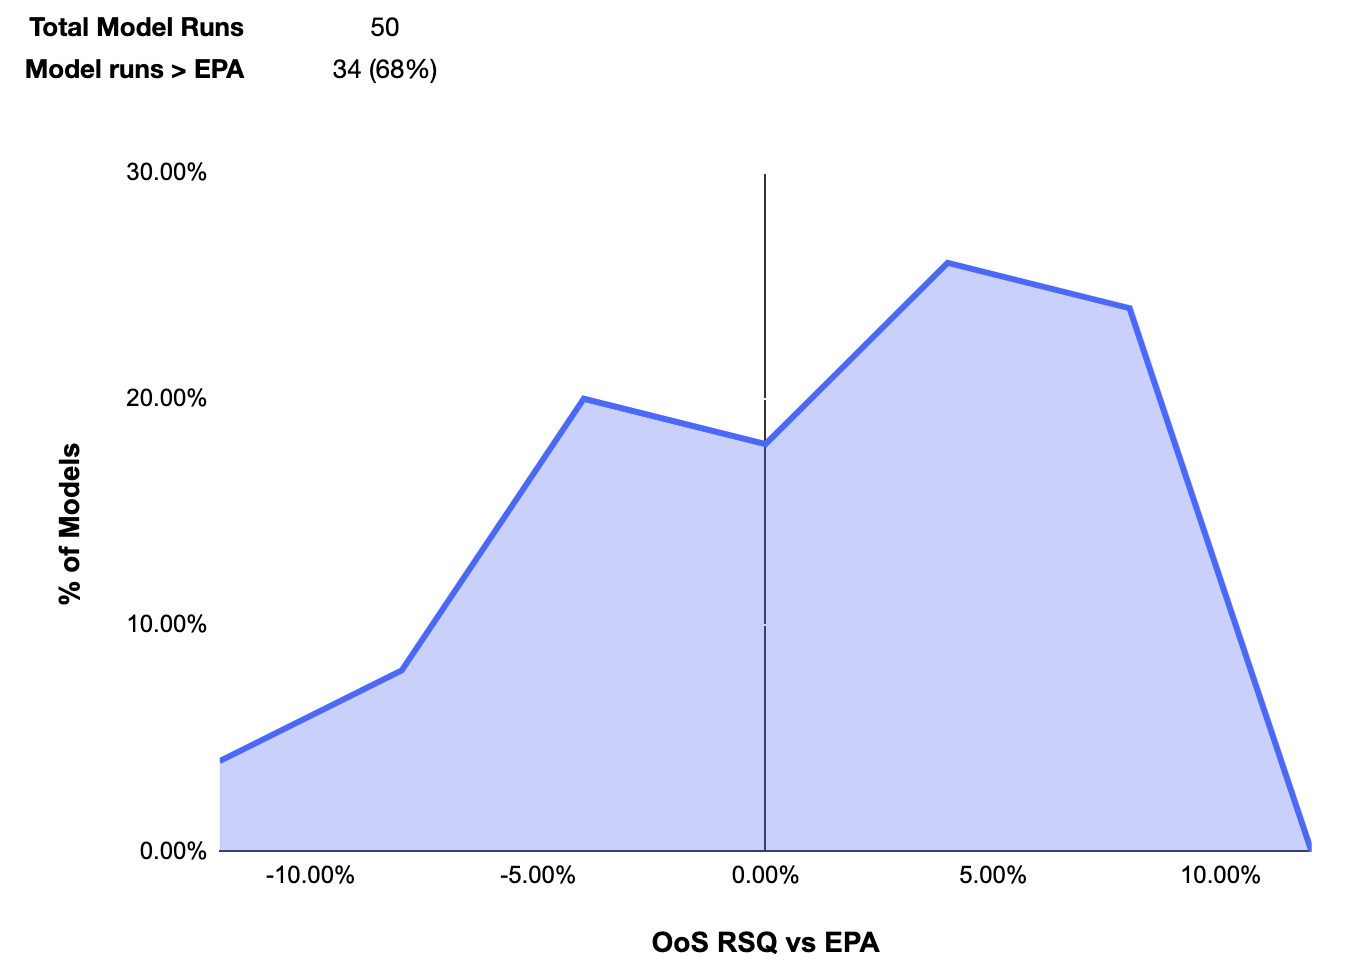
While the model still showed lift, the median lift was significantly lower than what was observed under the previous approach. To see which features may be negatively impacting the model, the same analysis was run with each feature dropped. This performance was then compared to the performance when all variables were included:
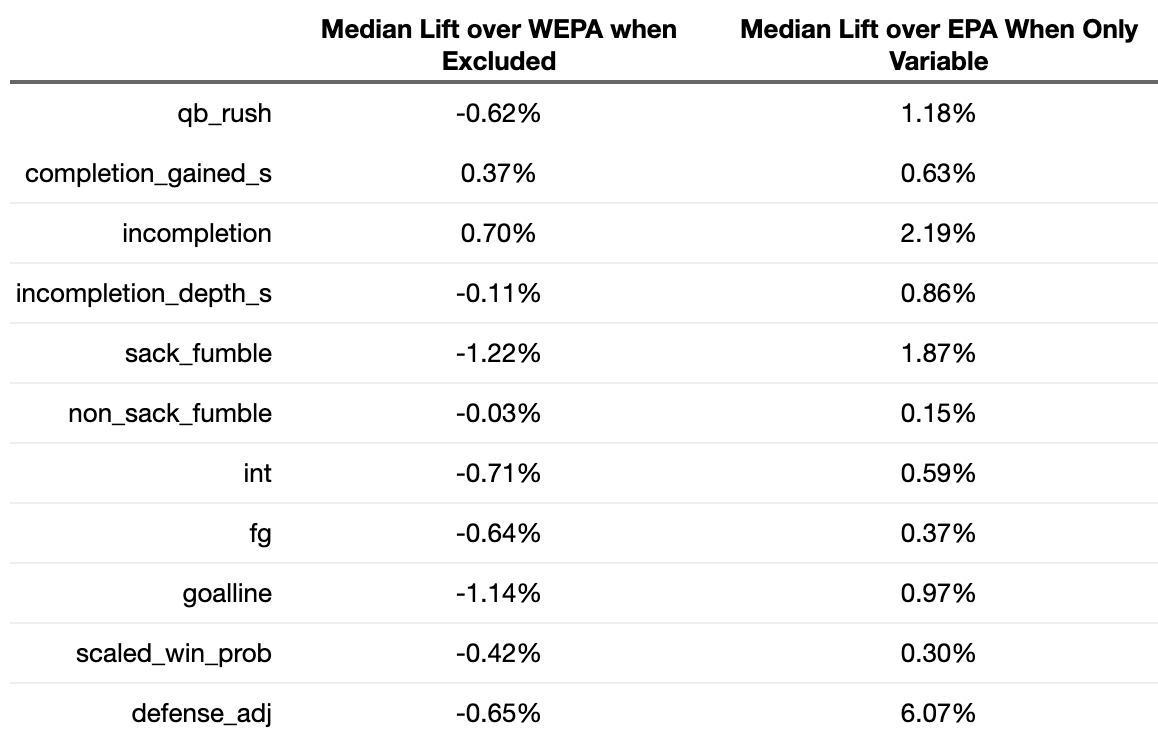
Each feature showed lift on its own relative to a baseline EPA, but not all features improved WEPA. WEPA models with completion_gained_s and Incompletions excluded generally performed better despite the fact that these variables typically created lift over EPA when all other variables were excluded.
This collection of variables does seem to provide meaningful lift over EPA, but the somewhat disappointing and volatile lift seen in the secondary validation approach, suggests that the model may work well under the primary validation approach simply because a chronological ordering of data cut training and testing datasets in a way that worked well for the features.
Furthermore, WEPA’s 3.75% median lift was lower and more volatile than a simple downweighting of opponent EPA (defense_adj). One potential reason for this behavior is the way WEPA applies weights.
The defense adjustment is applied on an already weighted EPA. Not only does this create unnecessary links across variables as described above, it also assumes that offensive and defensive weights should be the same for the same type of play. If something like an interception is largely an offensive stat, it’s not unreasonable to assume it may provide signal for the offense and not the defense. Perhaps an interception should be slightly discounted when calculating offensive WEPA and significantly discounted calculating defensive WEPA:

Dropping completion_gained_s and incompletion, while calculating separate weights for offensive and defensive features doubled the model’s performance relative to baseline EPA:
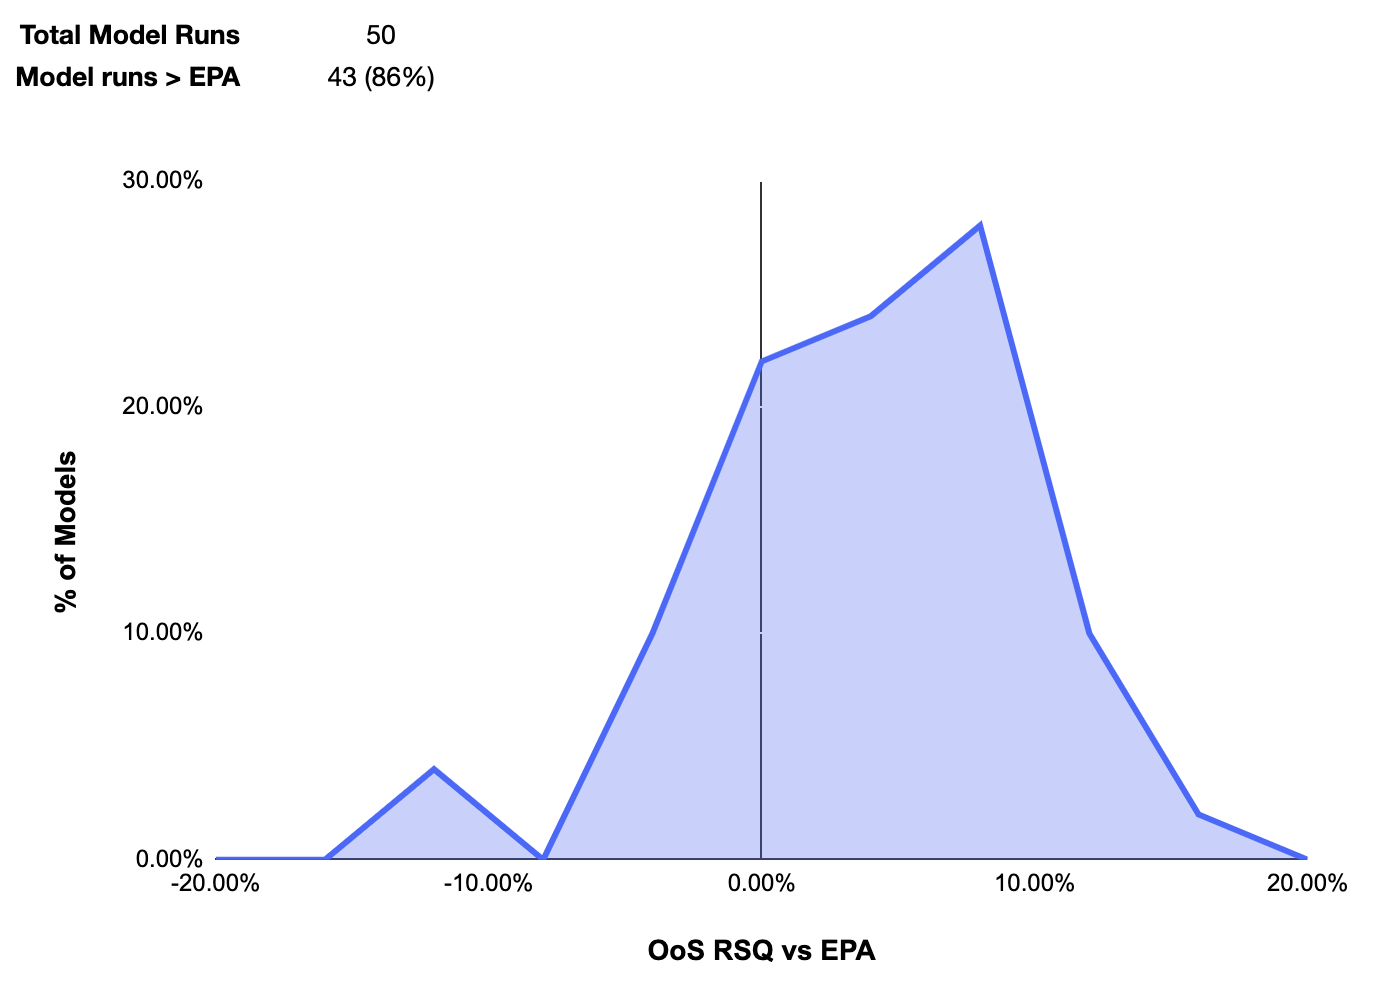
And further, highlighted non-performant variables:
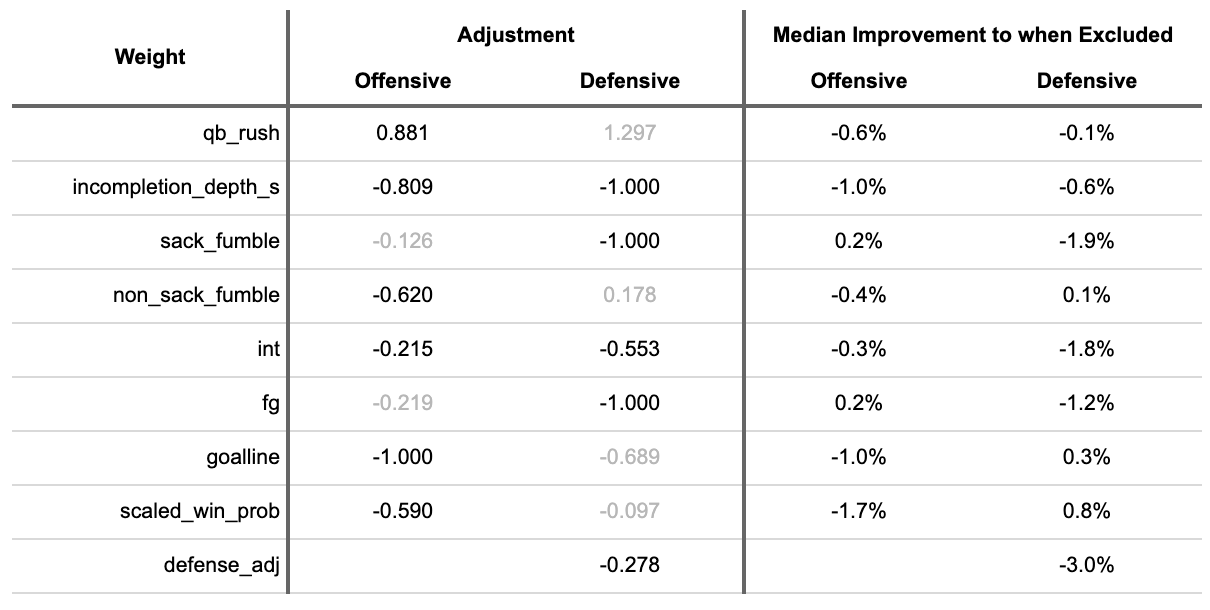
These splits make sense. Plays largely controlled by the offense provide signal for future offensive performance, and noise for future defense performance.
Using this new approach, features that seemed to introduce noise were dropped and features that were previously thought to introduce noise were re-incorporated. Through trial and error, a final model was created using the following features:

This model significantly improved performance through the second validation method:
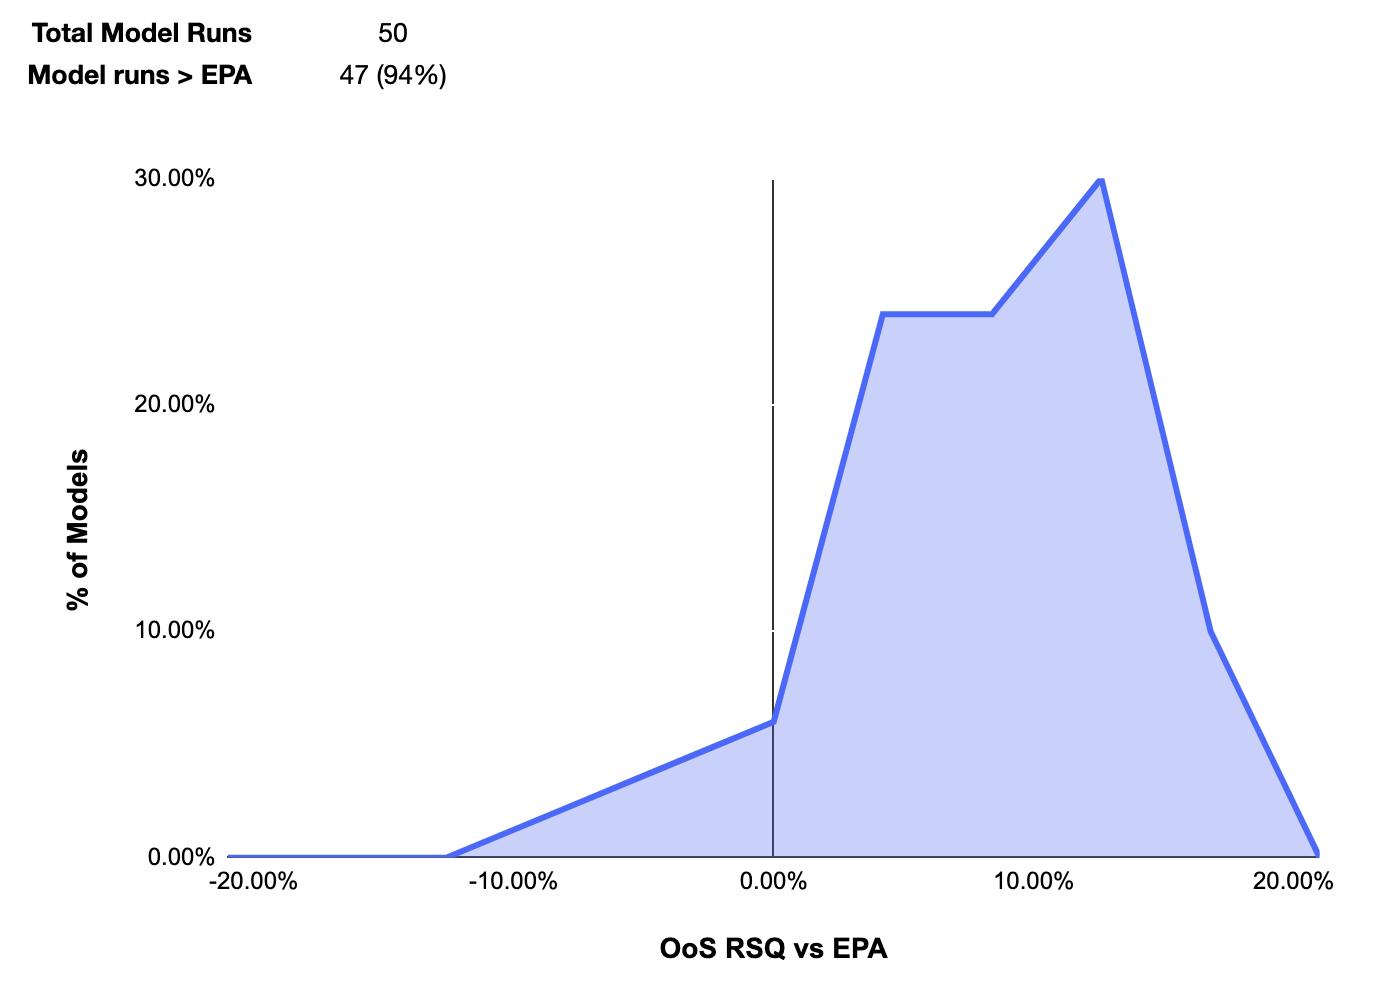
And resulted in strong performance in the original validation approach:
Running multiple random testing and training splits is computationally time consuming, often taking days to complete. While future experimentation could likely yield further improvement, the model building process was stopped here.
Comparing performance
The ultimate goal of WEPA is to provide an open-source model that is better than alternatives. While many quantitative models for measuring team performance and predicting future performance exist, DVOA’s popularity and documented performance made it a logical benchmark.
For each season, WEPA models were trained using all backward looking data available. For instance, predictions for the 2015 season were made using a model trained on all data from 1999 through 2014.
DVOA uses opponent performance to update a team’s rating. A team’s DVOA through 5 games changes depending on whether it was calculated through week 5 of the season or week 15. To ensure a true comparison of models using backward looking data only, DVOA was taken at a point in time as per FBO’s historical DVOA database. For instance, a team’s 5 game DVOA was its DVOA as of the week in which its 5th game was completed.
Each model was compared based on their ability to predict a team’s point margin through the rest of the season based on their performance through “X” games:
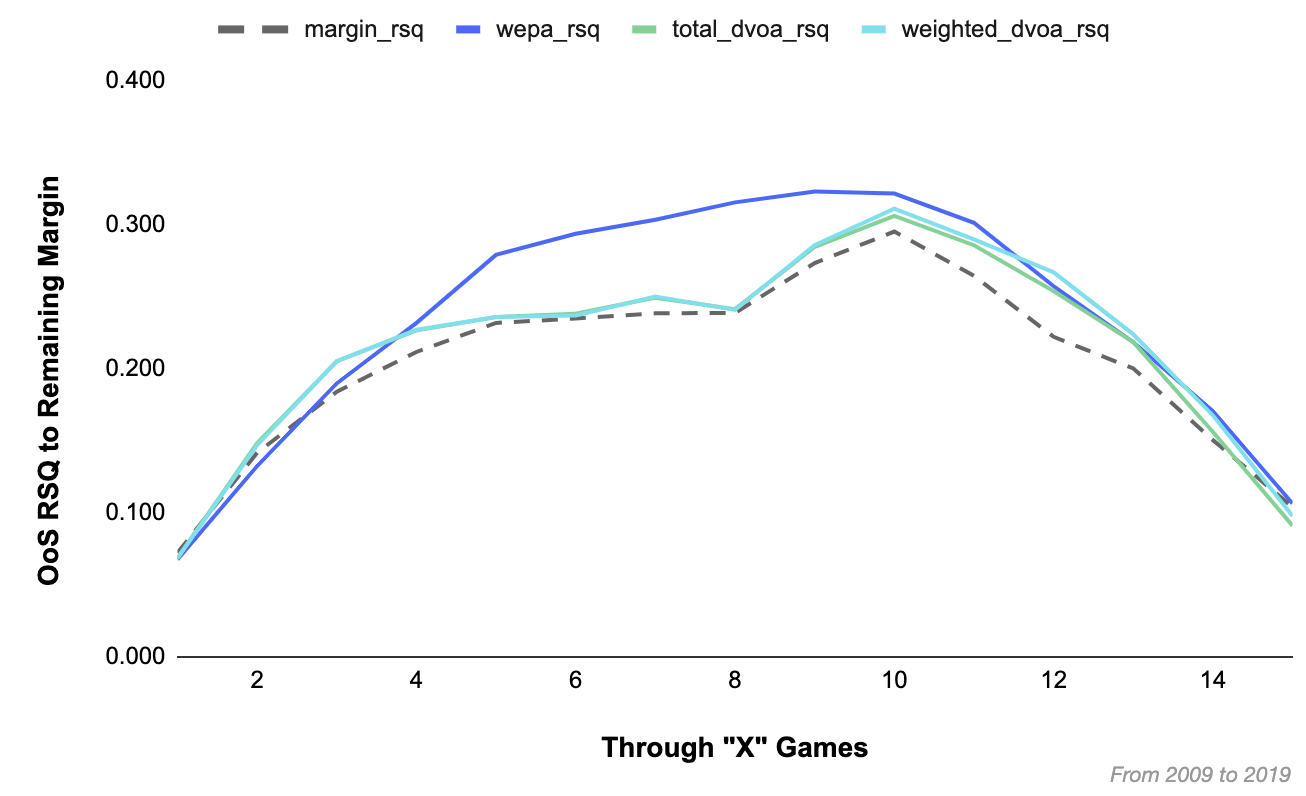
WEPA and DVOA both outperformed simple point margin, with WEPA performing significantly better over the middle weeks of the season. Looking at the same data relative to simple point margin makes the comparison easier to see:
WEPA is trained to maximize OoS RSQ through exactly 8 games, which is perhaps why it performs so much better under this approach to performance assessment. That said, WEPA still performs as well or better than DVOA under most other windows as well.
To avoid using a test of performance that inherently favors WEPA, performance was also assessed based on year-over-year (YoY) predictiveness. In this approach, a team’s performance through Week 17 of a season was used to predict their full season performance in the following season (T+1):
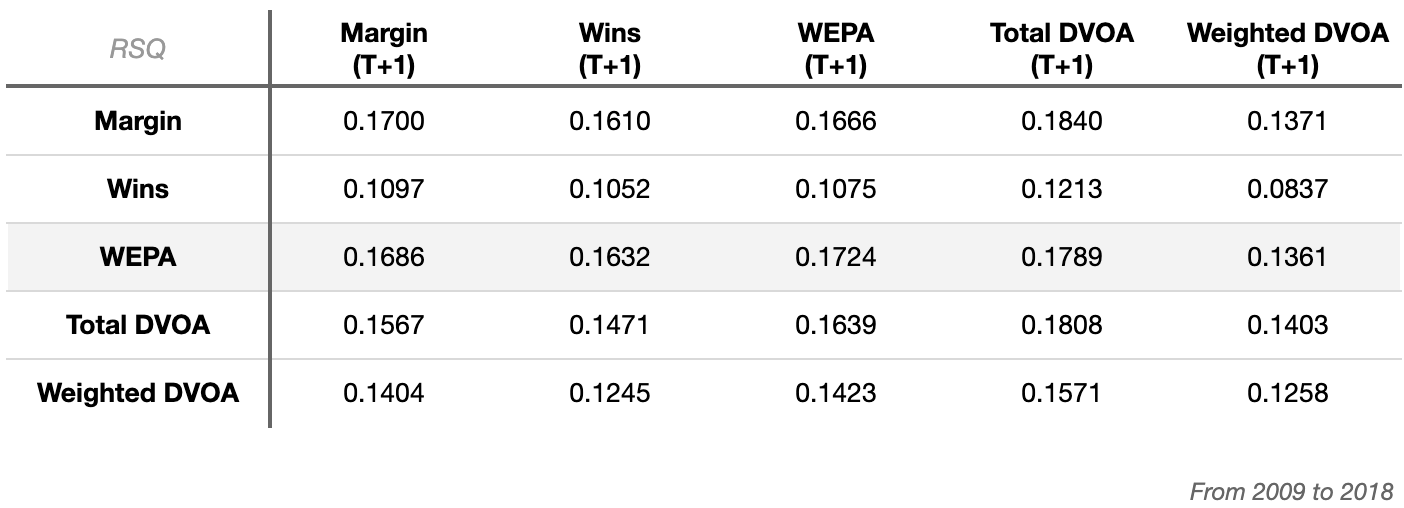
Even under this second approach to performance assessment, WEPA predicted future point margin better than DVOA.
As an anecdotal aside, it’s been noted that DVOA does a better job of predicting future wins than margin. The available posts on this topic used a larger dataset (i.e. not just 2009 to 2018), and compared the predictiveness of DVOA and pythagorean wins, which are different from pure margin. Though the analysis above suggests margin may perform better than DVOA, it is important to note that the superior performance is specific to this context.
Closing Thoughts
Based on the preceding analysis, it seems reasonable to conclude that WEPA is a powerful tool for predicting future performance, and that it achieves its goal of providing a more predictive alternative to proprietary metrics.
Perhaps most notable is the fact that WEPA achieves these results on publicly available and free data. Anyone can recreate these results, validate the analysis, and improve on the work. It is my sincere hope that the analytics community will strengthen the WEPA model by looking at it with a critical eye--ripping it apart, identifying shortcomings, discovering new features, and ultimately rebuilding it into a better version of itself.
For those looking to do so, feel free to explore the code here and tweet me (@greerreNFL) with questions.

@greerreNFL
NFL Analytics and Betting
Follow